What the Calculator Compares
The tool runs two loan types — a fixed-rate mortgage and an ARM of your choosing — through multiple rate scenarios and shows total interest cost, monthly payment trajectory, and the crossover year side by side.
For the ARM, the calculator doesn't assume rates stay flat after the fixed period ends. It models four distinct paths:
- ARM — rates flat: Index never changes; rate stays at initial level (most optimistic)
- ARM — moderate rise: Rates increase gradually after the fixed period
- ARM — significant rise: More aggressive rate increases
- ARM — worst case (full caps): Rate hits every cap as quickly as allowed (most conservative)
Running all four exposes the full range of financial outcomes you're accepting when you choose an ARM.
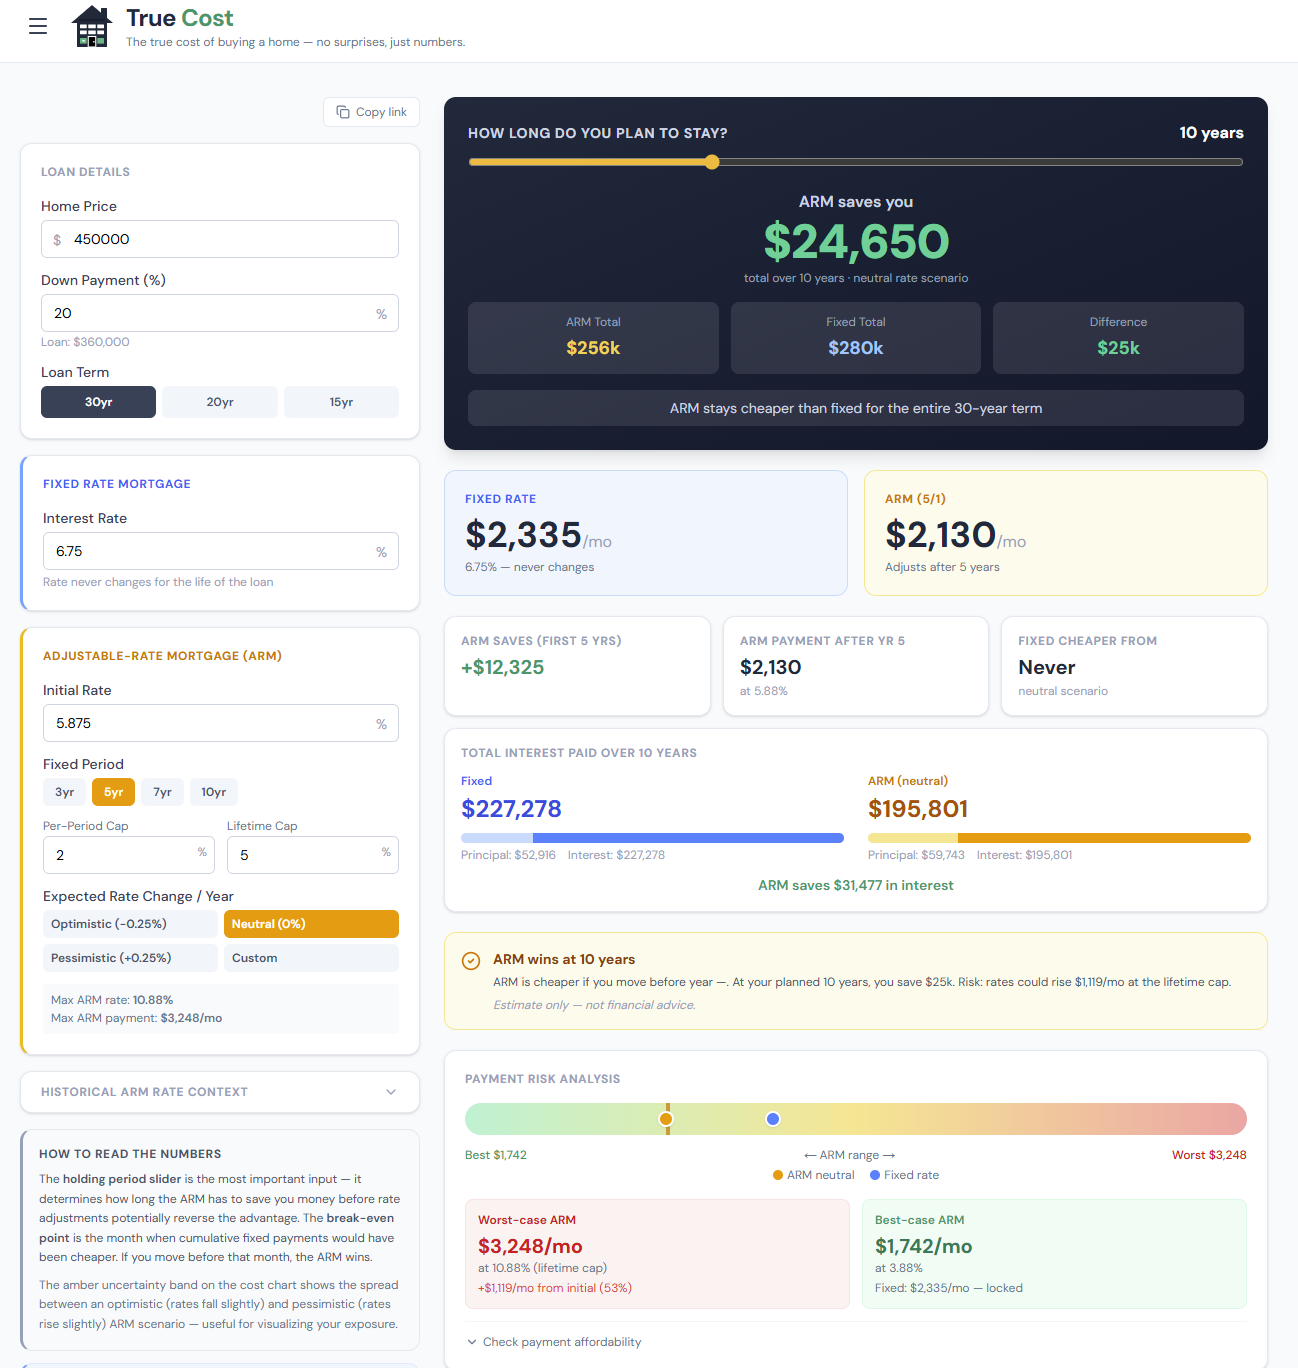
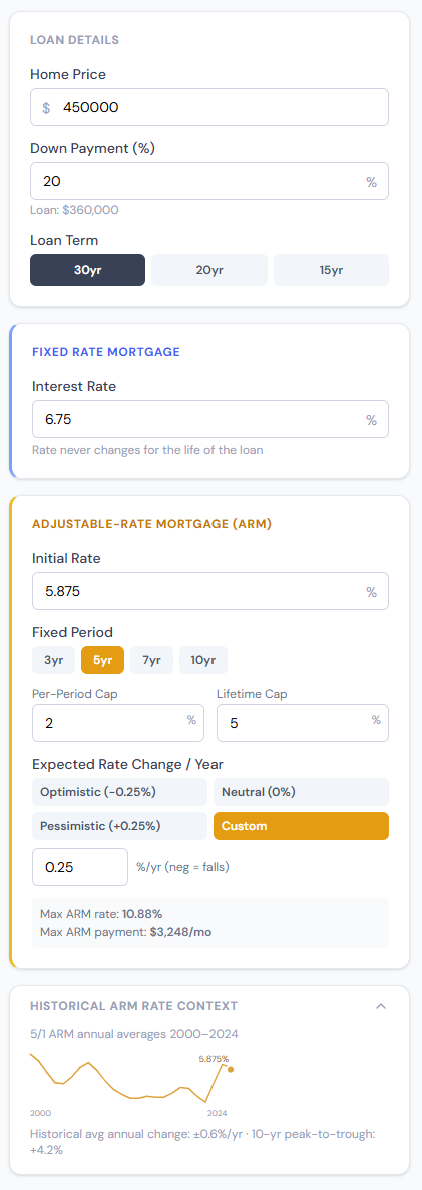
The Inputs Panel
The inputs are split between the fixed loan and the ARM structure. Getting the ARM cap structure right is the key to a useful analysis.
 click to enlarge
Fixed Loan Input
Just the rate you've been quoted for a 30-year fixed — straightforward.
ARM Structure Inputs
| Input | What it means | Typical values |
|---|---|---|
| ARM Initial Rate | Rate during the fixed period | 0.5–1.5% below fixed |
| Fixed Period | Years before first adjustment | 5 (5/1 ARM), 7 (7/1), 10 (10/1) |
| Adjustment Frequency | How often it adjusts after fixed period | Annual (most common) |
| Initial Cap | Max rate increase at first adjustment | 2% or 5% |
| Periodic Cap | Max rate increase at each subsequent adjustment | 2% |
| Lifetime Cap | Max rate increase ever (above initial rate) | 5% or 6% |
Understanding the Cap Structure
The cap structure is written as three numbers — for example, 2/2/5:
- First number (2): initial cap — rate can't jump more than 2% at the first adjustment
- Second number (2): periodic cap — rate can't jump more than 2% at any subsequent adjustment
- Third number (5): lifetime cap — rate can never be more than 5% above the initial rate
A 5/2/5 structure is common for some products: the first adjustment can be as large as 5% (payment shock risk), then 2% per subsequent adjustment, with a 5% lifetime maximum.
Always get the exact cap structure from your lender's term sheet before using this calculator — it changes the worst-case scenario significantly.
The Four Rate Scenarios
This is where the Fixed vs. ARM Calculator earns its keep. Instead of modeling one optimistic scenario, it shows you the full range.
 click to enlarge
The four scenario lines show cumulative interest paid under each ARM path, compared to the fixed loan's straight line. Notice how the scenarios diverge after the initial fixed period ends (year 5 for a 5/1 ARM).
What each scenario tells you:
- ARM flat: If rates don't rise, how much cheaper is the ARM over your ownership period? This is the maximum upside.
- ARM moderate rise: A more realistic scenario for a normal rate environment. Is the ARM still cheaper after modest adjustments?
- ARM worst case: If every cap hits as fast as possible, how much more does the ARM cost? Can you afford that payment?
If the worst-case ARM is still cheaper than the fixed at your expected horizon, the ARM has a strong case. If worst-case ARM costs significantly more, you're taking meaningful financial risk for the lower initial rate.
The Charts: Monthly Payment and Total Interest
The calculator produces two key charts, each revealing a different dimension of the comparison.
 click to enlarge
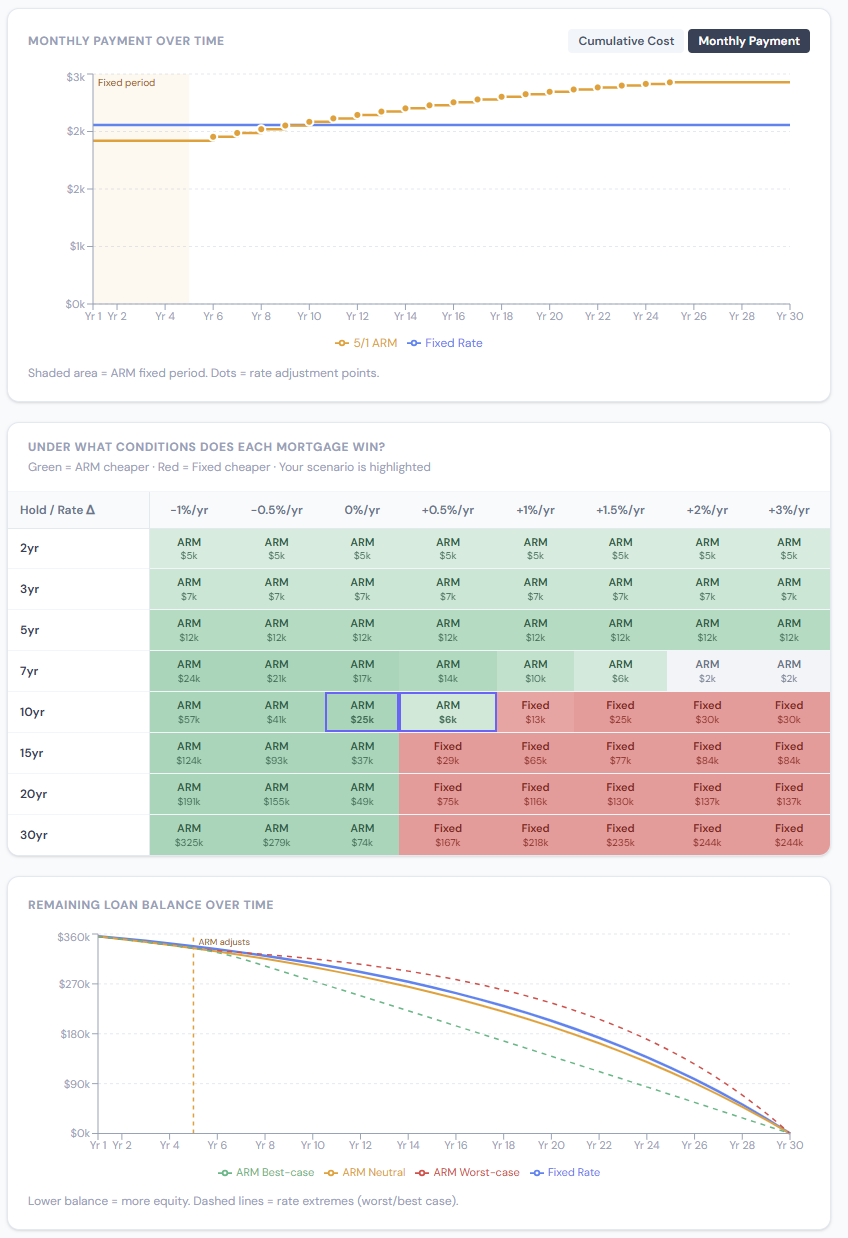
Monthly Payment by Year
The payment chart shows what you'd owe each month under the fixed loan vs. each ARM scenario. The ARM lines are flat during the initial fixed period, then step up (or spike, in the worst-case scenario) at each adjustment.
What to look for:
- Payment shock at the first adjustment: How large is the monthly payment jump? On a $400K loan, a 2/2/5 structure means the first adjustment could add up to $200–500/month overnight. A 5/2/5 structure could add $700+/month at the first adjustment.
- Plateau in the moderate-rise scenario: After a few adjustments, the ARM often stabilizes. If the plateau payment is manageable and still below the fixed, the ARM looks reasonable under moderate conditions.
- Could you absorb the worst case?: If the worst-case payment becomes unmanageable, that's a solvency risk — not just a financial suboptimality.
Cumulative Interest
The cumulative interest chart shows total interest paid since origination for each option. Fixed loans front-load interest but the rate never changes. ARM loans start cheaper but accumulate interest faster as rates rise.
The crossover year is marked on this chart: the point where any ARM scenario's cumulative interest first exceeds the fixed loan's. Before this year, that ARM path has cost less in total interest. After it, the fixed loan wins.
Using the Crossover Year as a Decision Threshold
The crossover year (based on the moderate-rise scenario) is the most useful single output for a go/no-go decision:
- Planning to sell before the crossover: The ARM will likely cost less in total interest — ARM makes sense if you're confident in your timeline
- Planning to stay past the crossover: The fixed rate wins financially — unless you're confident you can refinance before the ARM gets expensive
For most people using a 5/1 or 7/1 ARM, the crossover under moderate-rise assumptions falls somewhere in the 7–12 year range. The worst-case crossover is typically 3–5 years.
Who Should Choose an ARM?
Strong case for ARM:
- You're buying a starter home and expect to sell or move within 5–7 years
- The initial rate is at least 0.75%+ below the fixed rate (small spreads don't justify the risk)
- You have strong cash flow and could absorb a payment increase without stress
- You expect rates to fall — at adjustment, you'd benefit from a lower index
Strong case for fixed:
- Long-term ownership plan (10+ years)
- Rate spread between fixed and ARM is small (less than 0.5%)
- Fixed rates are historically low relative to the last 30 years
- You're already stretching affordability — payment shock could cause real hardship
- Strong preference for payment certainty and simplicity
Step-by-Step Walkthrough
- Enter the fixed rate you've been quoted for a 30-year fixed
- Enter the ARM initial rate and fixed period from your lender's term sheet
- Enter the cap structure exactly as quoted (ask your lender for the 3-number cap format)
- Look at the payment chart: how large is the payment jump at the first ARM adjustment?
- Look at the crossover year on the moderate-rise scenario. Is it past your expected ownership horizon?
- Check the worst-case scenario: is that monthly payment something you could absorb?
- If all three answers are favorable — good crossover, manageable worst case, meaningful initial savings — the ARM has a real case
Frequently Asked Questions
What's the difference between the initial cap and the periodic cap? The initial cap governs the first adjustment only. Many ARM products allow a larger first adjustment (e.g., 5%) then limit subsequent ones to 2%/year. The 5/2/5 structure is particularly important to understand: the first adjustment could be a 5% rate jump, which on most loan amounts causes a severe payment shock. A 2/2/5 structure is much gentler at the first adjustment.
How does payment shock actually work? If your ARM starts at 5.5% and adjusts to 7.5% on the first adjustment (2% initial cap), your payment on a $400,000 loan increases from about $2,271/month to $2,800/month — a $529 monthly increase with no prior warning beyond your original loan terms. The calculator shows this step change in the monthly payment chart.
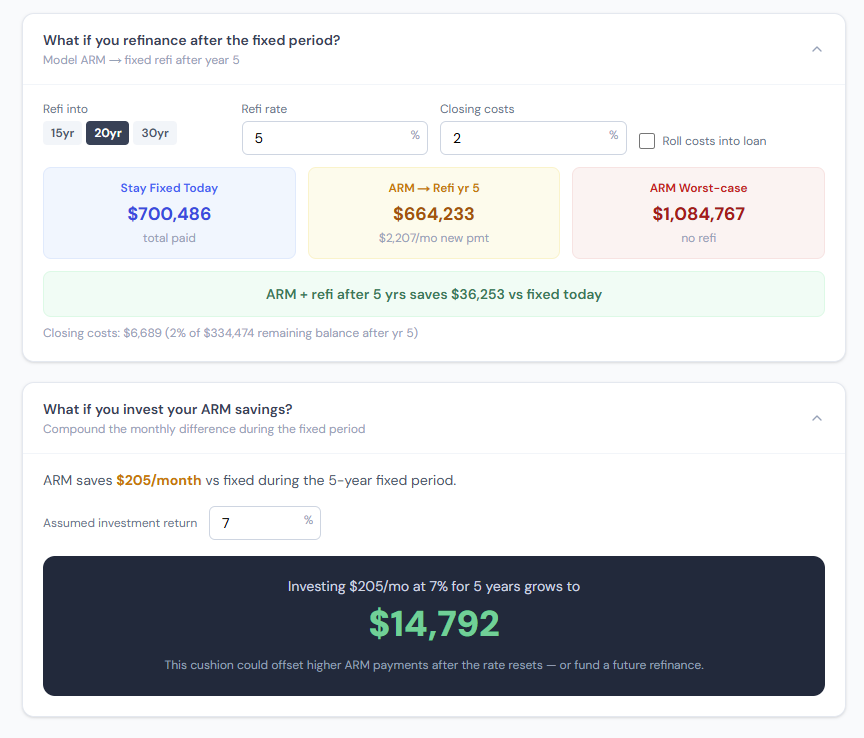
What happens if I refinance when the ARM adjusts? If you refinance before or at the first adjustment, the ARM functioned like a temporary fixed-rate loan — you got the lower initial rate and then moved on. This is the explicit strategy many ARM borrowers use: take the 5/1 ARM, plan to refinance (or sell) within 5 years. The Refinance Calculator helps you model whether a refi at that point makes sense.
Are ARMs available for investment properties? Yes. Investment property ARMs typically carry higher initial rates and margin than primary residence ARMs, but the same cap structure logic applies. Run the same analysis with the investment property rates.
What's SOFR and why does it affect my ARM? SOFR (Secured Overnight Financing Rate) replaced LIBOR as the primary ARM index in the U.S. Your ARM rate at each adjustment equals the current SOFR rate plus your margin (a fixed spread set at origination, typically 2.5–3%). As the Federal Reserve adjusts short-term rates, SOFR moves in lockstep — which is why Fed rate decisions directly affect variable-rate mortgage holders.