What the Calculator Computes
Enter the full picture of a rental property — purchase price, financing, rental income, vacancy, and all operating expenses — and the calculator returns a comprehensive investment scorecard:
- Cap rate — Return on asset value, ignoring financing
- Cash-on-cash return — Cash return on cash invested (down payment + costs)
- Gross Rent Multiplier (GRM) — Price as a multiple of annual gross rent
- Debt Coverage Ratio (DCR) — Whether the property covers its mortgage
- IRR — Annualized total return including appreciation and exit proceeds
- Hold-period analysis — Returns at 5, 10, 15, and 20 years
Understanding the Key Metrics First
Before the inputs, understanding what each metric measures makes the results far more useful.
Cap Rate = Net Operating Income ÷ Purchase Price
This is the property's unleveraged return — what it would earn if you paid cash with no mortgage. It's used to compare properties across markets and to assess whether you're paying a fair price relative to the income generated. A 6% cap rate means the property earns 6 cents of net income per dollar of value. Cap rates vary dramatically by market: coastal metros often trade at 3–5%; secondary cities at 6–9%.
Cash-on-Cash Return = Annual Pre-Tax Cash Flow ÷ Total Cash Invested
This measures the actual cash you receive relative to the cash you put in (down payment + closing costs + upfront repairs). Unlike cap rate, it accounts for financing — so a leveraged deal with a good mortgage rate can show a cash-on-cash return well above the cap rate. A 8% CoC means you get $8 back for every $100 deployed in a year.
Debt Coverage Ratio = Net Operating Income ÷ Annual Debt Service
DCR below 1.0 means the property doesn't cover its mortgage from rental income — you're writing a check each month. Most conventional lenders require DCR ≥ 1.25 to qualify for financing. Knowing your DCR before you apply saves you from pursuing a deal that can't be financed.
IRR = the annualized return that makes all cash flows — initial investment, annual cash flows, and terminal sale — net present value to zero. It's the closest thing to an apples-to-apples comparison with stock market returns or other investment vehicles.
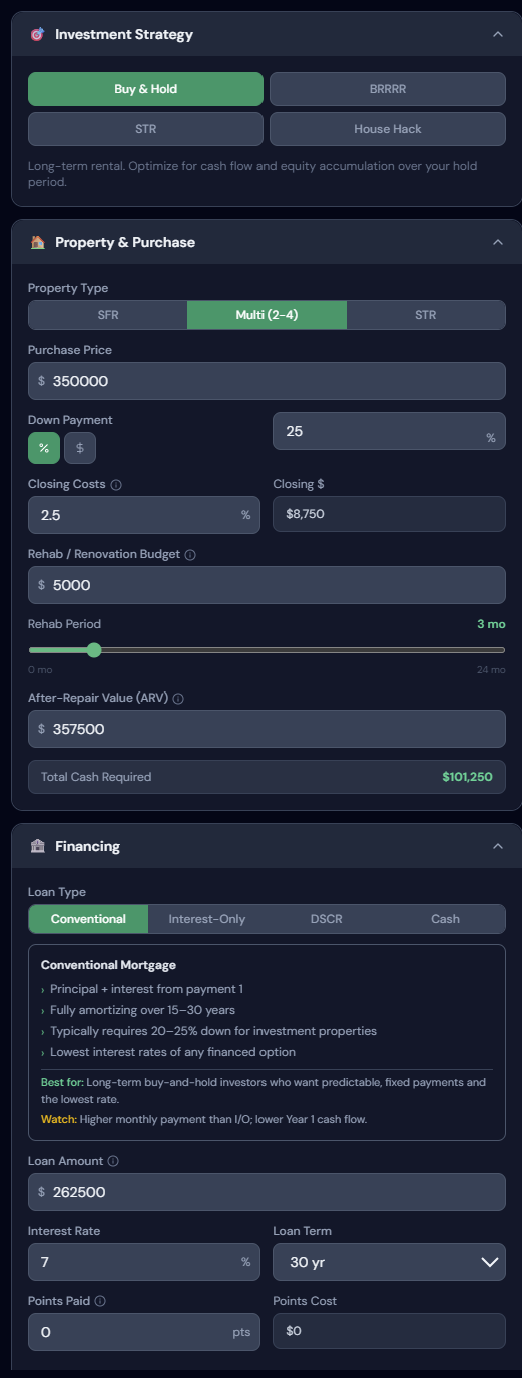
The Inputs — Part 1: Property and Financing
The first inputs panel covers the acquisition and financing structure.
 click to enlarge
| Input | What it controls | Notes |
|---|---|---|
| Purchase Price | Acquisition cost | Your offer price |
| Down Payment % | Cash deployed; leverage ratio | 20–25% typical for investment property |
| Closing Costs | Upfront transaction fees | 2–4% of purchase price |
| Upfront Repairs/CapEx | Immediate improvement budget | Renovation or make-ready costs |
| After-Repair Value | Post-renovation market value | For value-add or BRRRR deals |
| Interest Rate | Investment property mortgage rate | Typically 0.5–1.5% above primary rates |
| Loan Term | 15 or 30 years | Longer term = lower payment; more interest |
Important on the interest rate: investment property loans are priced differently than primary residence loans. Lenders consider them higher risk (borrower is more likely to default on an investment than their home). Expect to pay 0.5–1.5% more than a comparable primary residence rate, and to put at least 20% down — many lenders require 25% for multi-unit properties.
The After-Repair Value field is relevant for value-add investing: you're buying a distressed property, improving it, and refinancing based on the new appraised value (the BRRRR strategy). The calculator uses ARV to model your refinanced equity position.
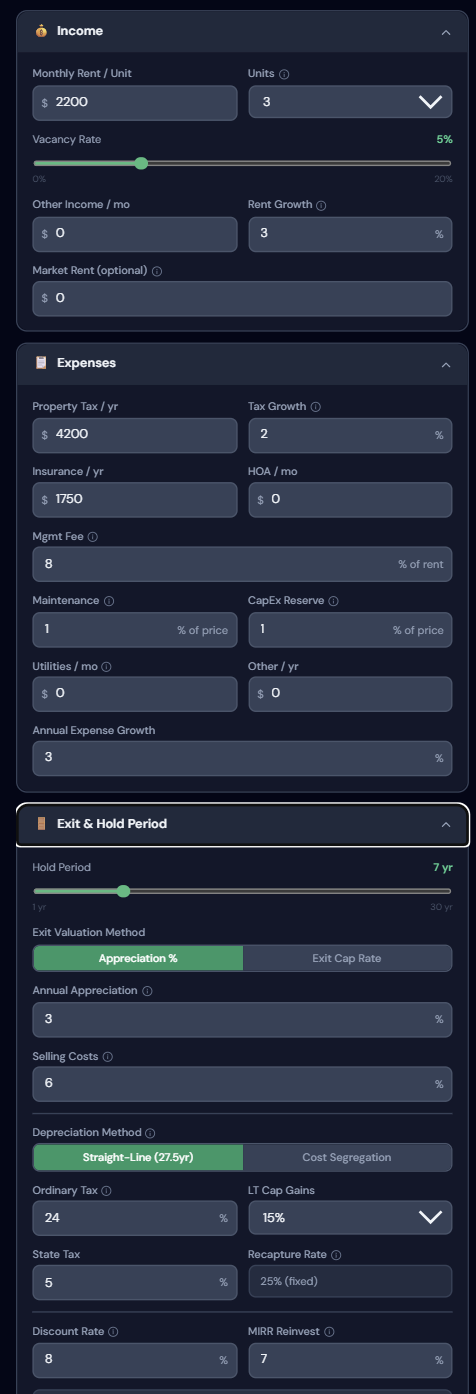
The Inputs — Part 2: Income and Operating Expenses
The second panel covers the revenue and cost structure — what determines whether the property actually makes money.
 click to enlarge
Income Inputs
| Input | What to enter | Notes |
|---|---|---|
| Monthly Rent | Current or market rent | Research on Zillow, Rentometer, or via a PM |
| Vacancy Rate | % of time unrented | 5–8% for stable long-term; higher for short-term |
| Other Income | Laundry, parking, storage, etc. | Enter 0 if none |
Your rent estimate is the single most impactful input in the model. A $100/month rent error compounds across every year of the hold period and dramatically shifts IRR. Spend time researching actual comparable rents — not Zestimate estimates, but current leased comps from a local property manager or recent Zillow rental listings.
Operating Expense Inputs
| Input | Typical range | What's often missed |
|---|---|---|
| Property Management | 8–12% of collected rent | If self-managing, model it anyway — your time has value |
| Maintenance | 1–1.5% of home value/yr | The most frequently underestimated expense |
| CapEx Reserve | 0.5–1% of home value/yr | Roof, HVAC, water heater replacements |
| Insurance | $1,200–$2,500/yr | Landlord policy; higher than homeowner |
| Property Tax | Auto-fills from ZIP | Verify against county records for the specific property |
| HOA | 0 if none | Condo investing adds a layer of fixed cost |
CapEx reserve is the most common blind spot for new investors. Roofs ($10K–$25K), HVAC systems ($5K–$15K), water heaters, and appliances all fail eventually. Modeling a reserve ensures your returns aren't built on the false assumption that nothing ever needs replacing.
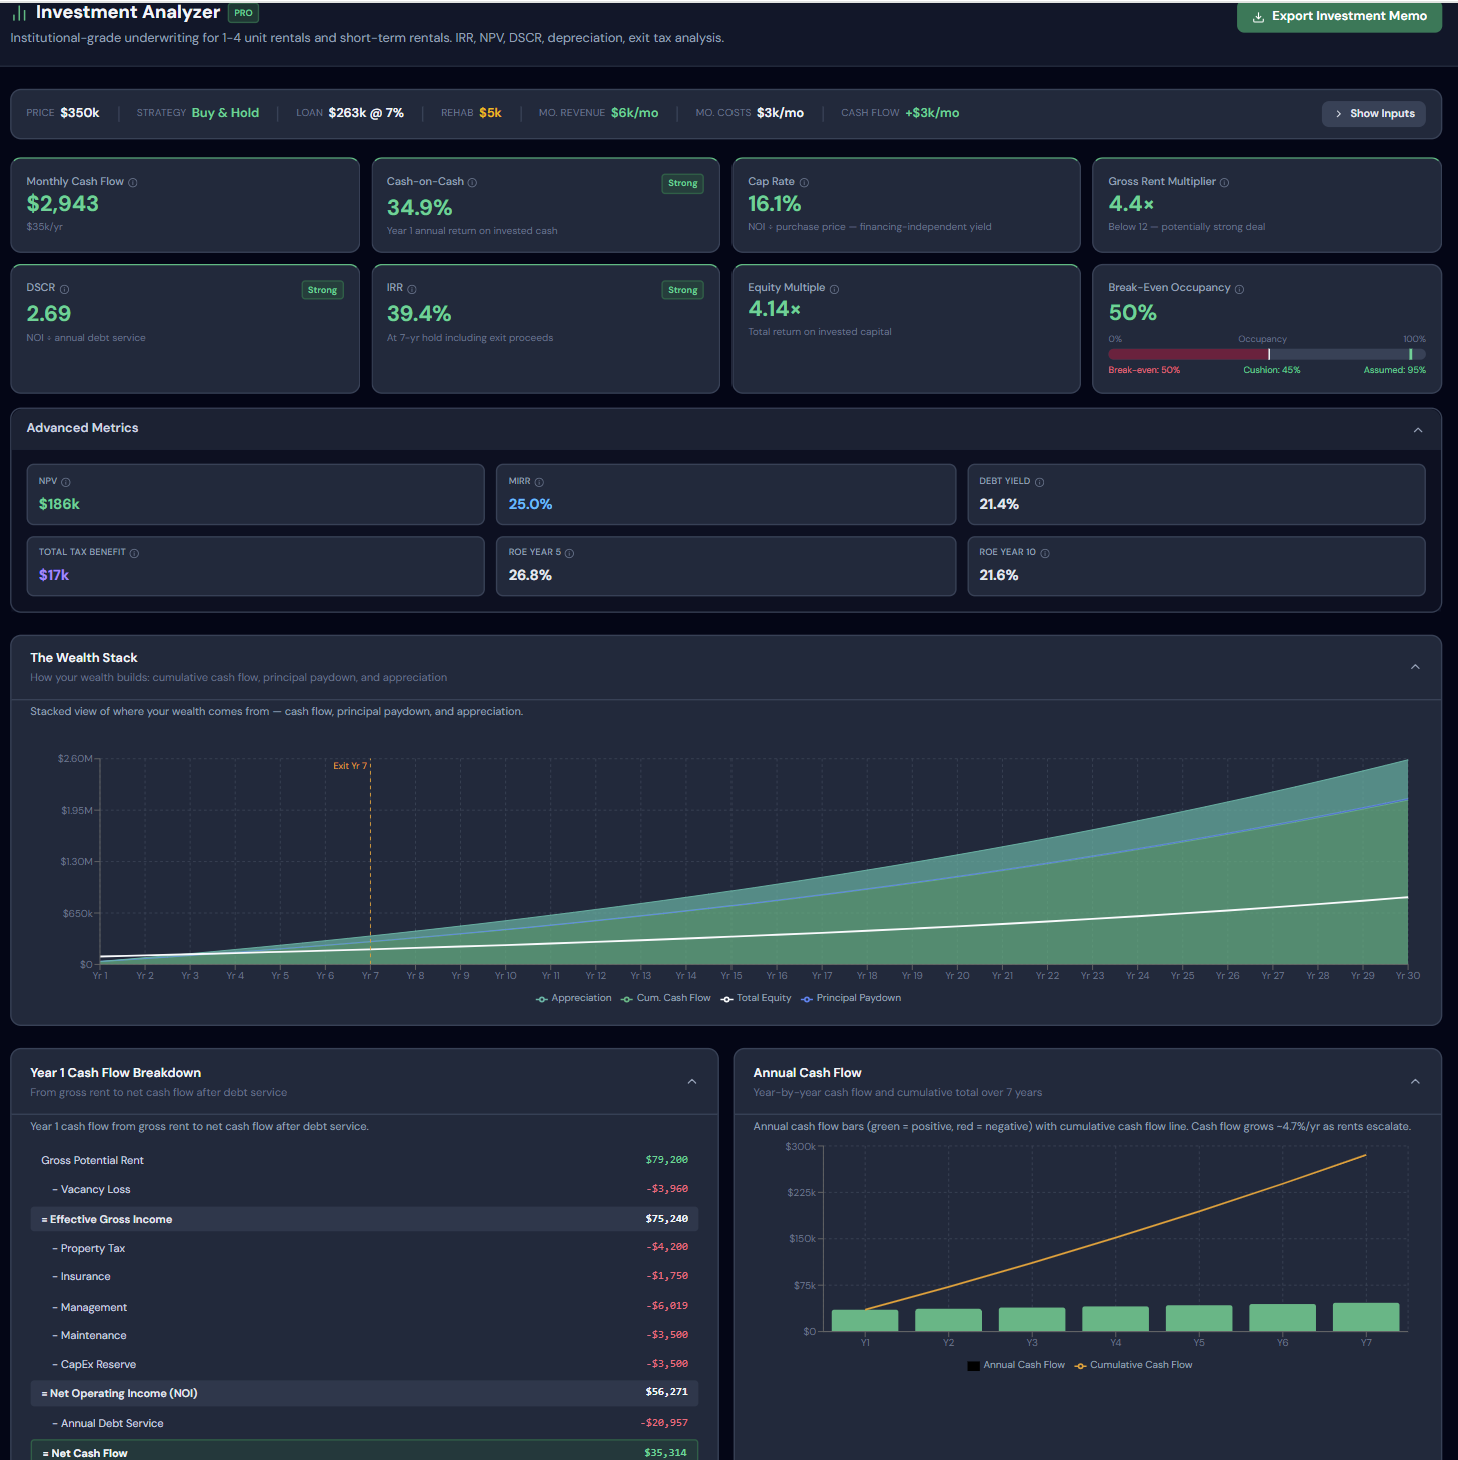
The Results Scorecard and Charts
Once inputs are complete, the calculator returns the investment scorecard, annual cash flow, and hold-period analysis.
 click to enlarge
The Scorecard
The top-line metrics appear immediately: cap rate, cash-on-cash return, DCR, and GRM. These are the first filter:
- Cap rate below 4%: Hard to justify unless appreciation expectations are very high or the asset quality is exceptional
- CoC below 5%: Consider whether capital markets (REITs, index funds) offer better risk-adjusted returns with less work
- DCR below 1.25: Financing may be difficult; below 1.0 means negative cash flow from day one
- GRM above 20: High price relative to rent; break-even is far out
None of these are hard cutoffs — context matters. A 4% cap rate in a market with 6% appreciation is very different from 4% in a flat market.
Annual Cash Flow
The cash flow chart shows pre-tax cash flow year by year as rents grow and (if applicable) as the mortgage amortizes. Watch for:
- Negative early years: Normal for some deals; becomes a problem if it persists more than 2–3 years
- Rate of improvement: A $200/month negative cash flow at year 1 that turns positive by year 3 and reaches $600/month by year 10 is a very different deal than one that stays marginally negative
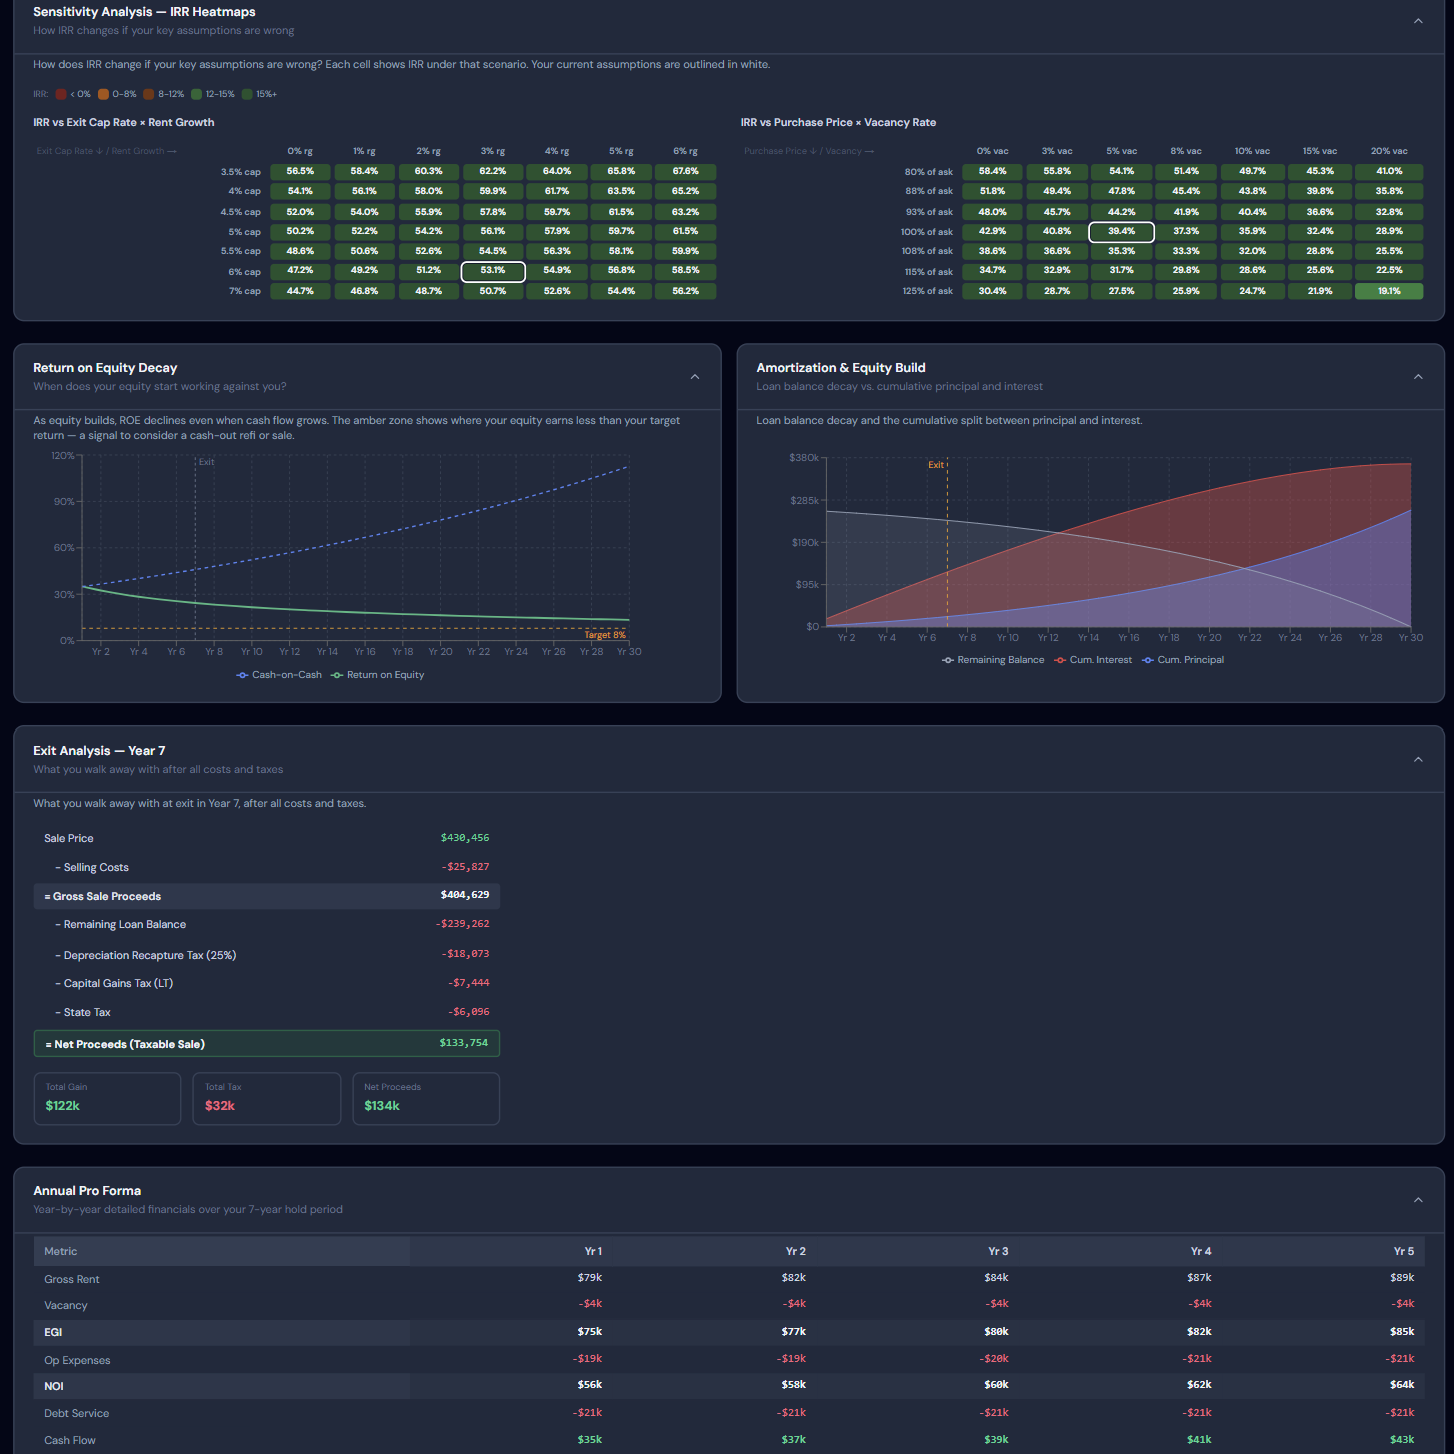
Hold-Period Analysis Table
The hold-period table shows IRR and net proceeds at 5, 10, 15, and 20 years. This is where the real investment case is made or broken.
At each horizon, the table includes:
- Equity accumulated (appreciation + principal paydown)
- Cumulative cash flow
- Net sale proceeds after 7% selling costs
- IRR for that hold period
Key observation: IRR typically improves with longer hold periods as appreciation compounds and the upfront transaction costs become a smaller share of total return. But there are diminishing returns — and opportunity cost of capital tied up in real estate for 20 years is real.
What Return Targets to Use
Context for typical return benchmarks:
| Return | Context |
|---|---|
| IRR < 8% | Below what most investors can get passively in index funds; need strong appreciation thesis |
| IRR 8–12% | Competitive range; justified if risk-adjusted (real estate is less volatile than equities) |
| IRR 12–18% | Strong deal; validate inputs carefully |
| IRR > 18% | Exceptional; double-check expense assumptions and rent estimates |
| CoC < 6% | Often better alternatives unless strong appreciation expected |
| CoC 8–12% | Target range for many investors |
| Cap rate 5–8% | Typical for residential investment in mid-tier markets |
Step-by-Step Deal Evaluation
- Enter the purchase price and down payment (use 25% if uncertain)
- Enter an investment property rate from a lender who does investor loans
- Enter monthly rent from a local property manager or Zillow comparable rentals
- Set vacancy at 7% (conservative for most stable markets)
- Enter all operating expenses — don't skip management (even if self-managing) or CapEx reserve
- Check the DCR first: below 1.25 and you likely can't finance it; below 1.0 and you're cash-flow negative
- Review the cap rate and CoC: do they meet your minimum threshold?
- Look at IRR at your target hold period: does it beat your alternative investment options?
- Run a sensitivity test: what if rent is $150/month less than expected? What if appreciation is 1% instead of 3%? Does the deal still pencil?
Frequently Asked Questions
What's a good cap rate for a single-family rental in 2026? Cap rates vary significantly by market. High-cost coastal markets (Boston, NYC, LA, Seattle) trade at 3–5% for single-family. Mid-tier markets (Atlanta, Dallas, Tampa, Columbus) range 5–8%. Secondary and tertiary markets can reach 8–12%. Compare your target cap rate to local alternatives — what other properties are trading at in that market.
Why is the investment property rate higher than my primary mortgage rate? Lenders classify investment properties as higher risk — statistically, borrowers are more likely to let an investment property go to foreclosure before their primary home during financial stress. The higher rate compensates for this risk. You'll also generally need 20–25% down, higher credit scores, and reserves of 6 months' payments.
Should I include property management even if I self-manage? Yes, for two reasons: (1) your time has real economic value — at $50/hour and 5 hours/month, self-management "costs" $250/month; (2) you may need to hire a manager in the future. Building it into the analysis ensures your returns don't depend on free labor.
How does depreciation affect the return analysis? Residential rental properties can be depreciated over 27.5 years (straight-line), which significantly reduces taxable rental income. This is a major tax advantage of real estate that the IRR calculator doesn't model (it's a pre-tax cash flow tool). Work with a CPA who specializes in real estate to understand the full tax picture, including depreciation recapture at sale.
What's the BRRRR strategy and how does this tool model it? BRRRR (Buy, Rehab, Rent, Refinance, Repeat) involves buying a distressed property, renovating it, renting it, refinancing based on the new appraised value (ARV), and using the cash-out proceeds to repeat the process. The calculator models BRRRR by using the ARV field — after renovation, your effective equity is ARV minus your refinanced loan amount. The refinanced terms replace the original purchase financing in the model.