The Four Paths
The calculator is built around four distinct scenarios, each representing a real option available to any homeowner relocating:
| Path | What happens to current home | What you do at destination |
|---|---|---|
| Sell & Buy | Sell; proceeds fund new purchase | Buy in new location |
| Sell & Rent | Sell; proceeds go into investments | Rent in new location |
| Keep & Buy | Keep as a rental property | Buy in new location |
| Keep & Rent | Keep as a rental property | Rent in new location |
Most people intuitively consider only the first path. The calculator forces a rigorous comparison of all four — because the "obvious" answer is frequently not the financially optimal one, especially for homeowners who bought before 2022 at historically low rates.
The Lock-In Effect: Why Keeping Often Wins
The most important factor in this analysis — and the one most people don't consciously quantify — is the mortgage lock-in effect.
If you bought at 3.5% in 2021 on a $400,000 loan, your monthly P&I is $1,796. The same $400,000 loan at today's 7% costs $2,661/month — a $865/month difference on identical debt. That gap is permanent for the life of the loan and represents the financial value of your existing mortgage.
Selling means surrendering that rate. A new purchase, even if cheaper, requires financing at current rates — often wiping out the purchasing power advantage. The Keep paths (3 and 4) preserve this advantage. The Sell paths give it up.
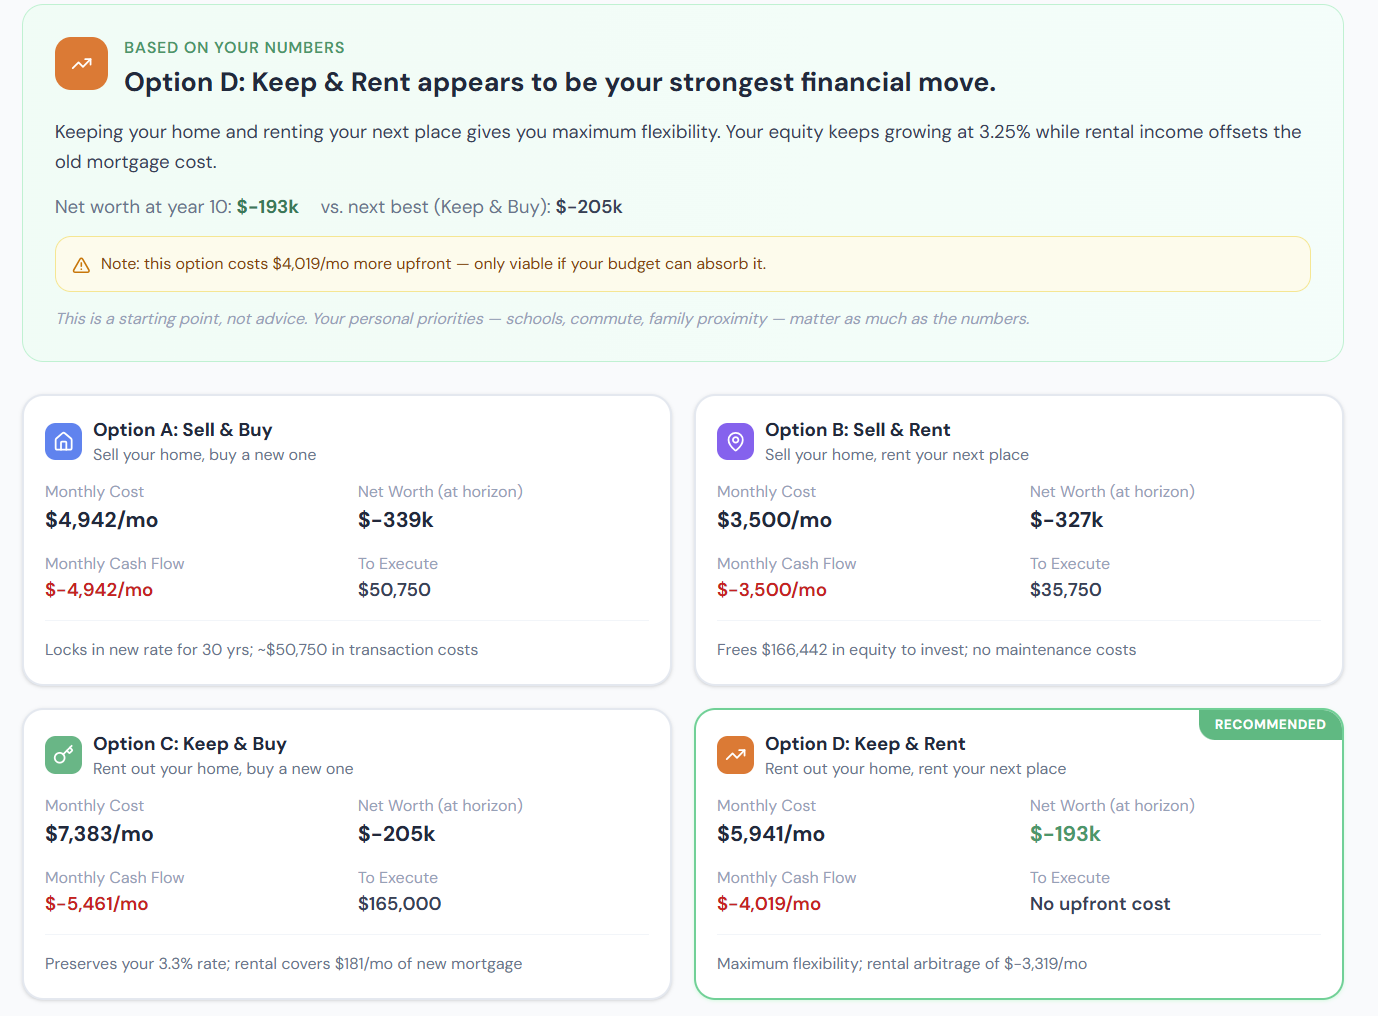
The Move or Stay Calculator quantifies this explicitly: the net worth projections for Keep paths include the value of that low-rate leverage on an appreciating asset. In many scenarios, especially for owners with sub-5% rates and meaningful appreciation in their current market, Path 4 (Keep & Rent) is the most financially compelling option — even though it's the least obvious one.
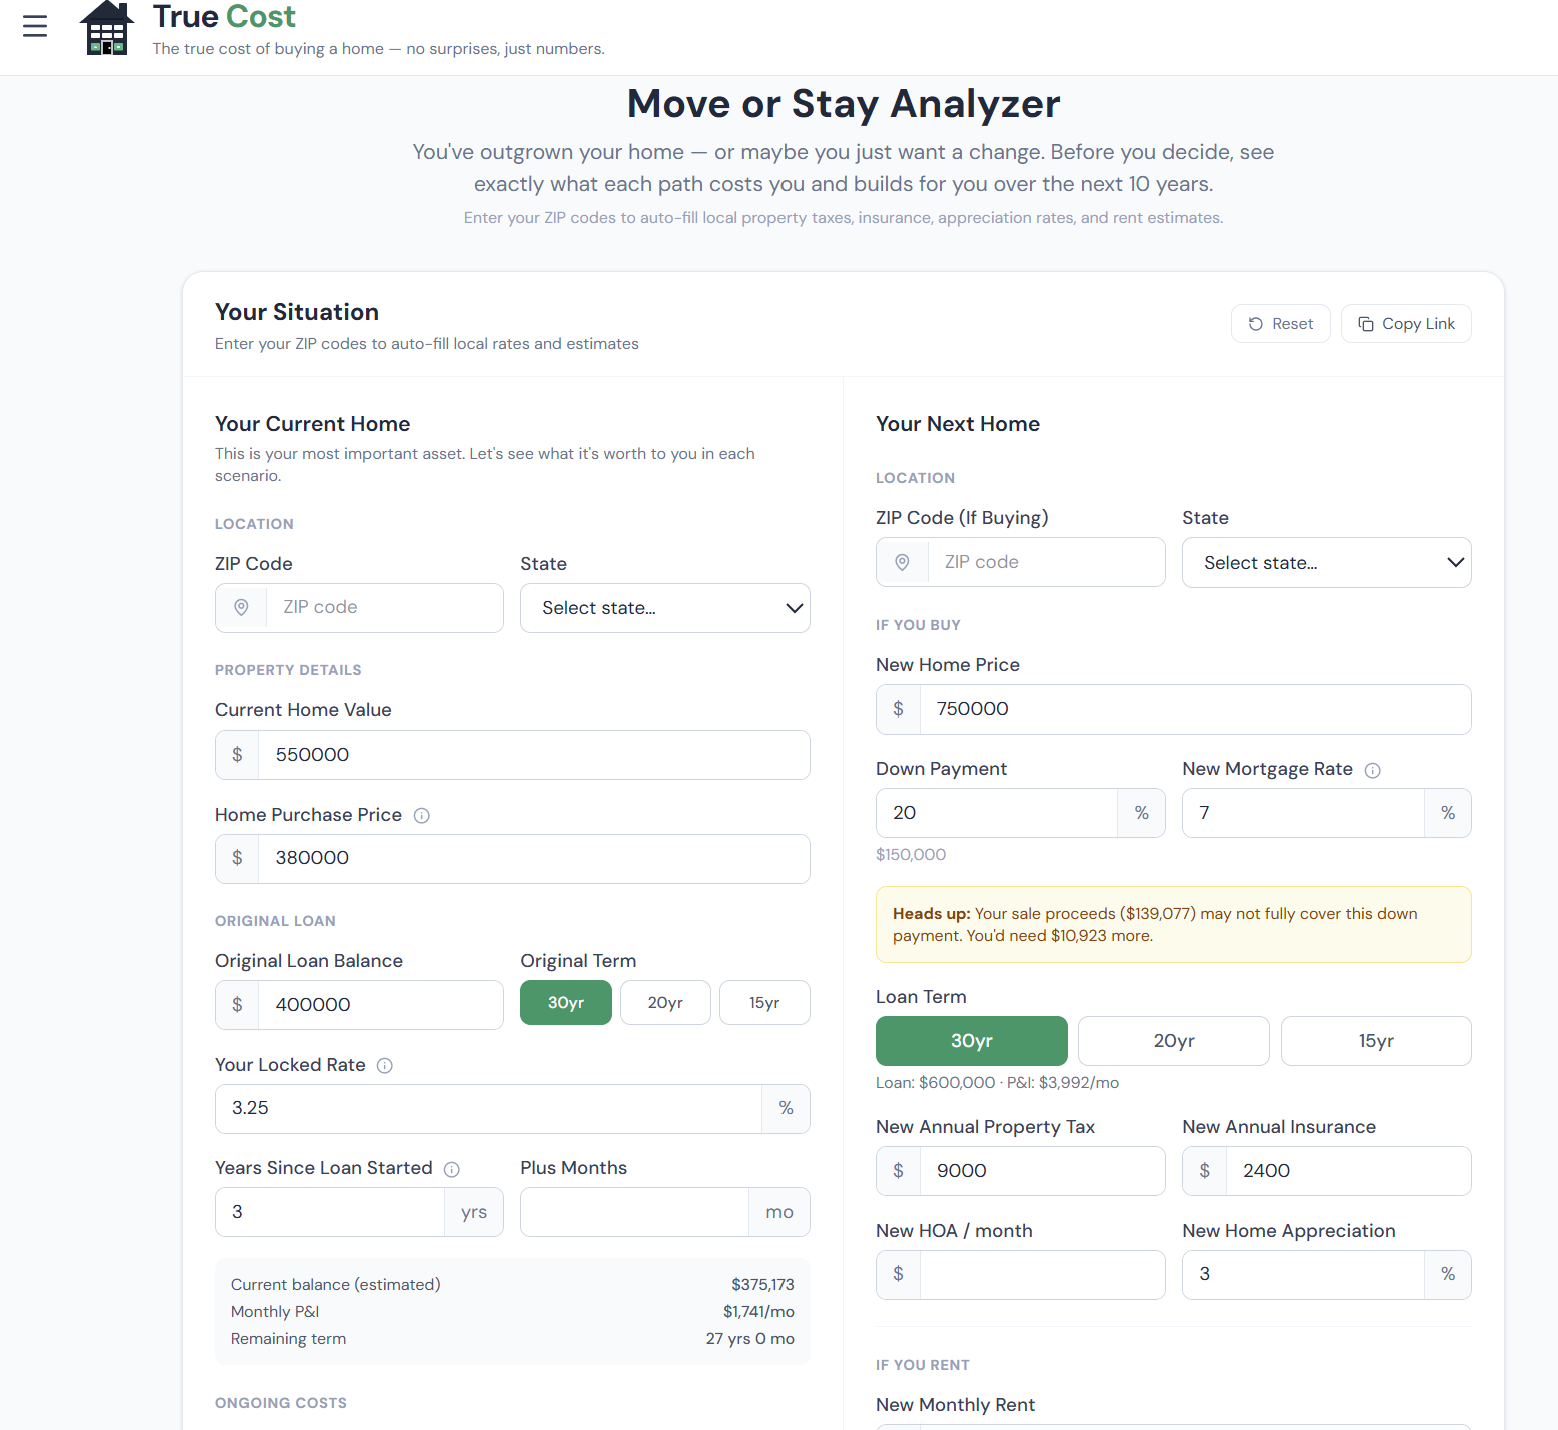
Understanding the Inputs
The inputs are split into two groups: your current home and your destination.
Current Home Inputs
Enter your current home's value, remaining balance, interest rate, monthly payment, and — critically — the rent you could realistically charge if you kept it.
The rental income estimate is one of the most important inputs in the model. Research current market rents for comparable properties in your area on Zillow, Rentometer, or by calling a local property manager. Don't overestimate — vacant months, turnover costs, and management fees all reduce effective income.
Destination Inputs
Enter the home price and expected mortgage rate if buying at the destination, and the monthly rent if renting. The calculator uses these to build the monthly cost structure for each path.
The Charts: Net Worth and Cash Flow
The calculator produces two key outputs that together tell the complete story.
 click to enlarge
The Net Worth Comparison
The primary chart shows projected net worth for all four paths over 10 years. Each line represents the total financial position — equity in any owned properties plus investable cash — at each point in time.
What to look for:
- Which paths converge, and which diverge? Some paths start behind (because you deploy more capital upfront) but pull ahead through equity growth and appreciation. Others start ahead but plateau.
- The gap at year 5 vs. year 10: If one path dominates at year 5 but all paths converge by year 10, the short-term differences are more about timing than long-term financial outcome.
- Which paths are within striking distance of each other? When two paths produce similar 10-year outcomes, the tie-breaker is cash flow demand, operational complexity, or personal preference — not math.
Monthly Cash Flow Demands
The second chart shows what each path actually requires from you month to month — the money that leaves your accounts before any investment returns.
This chart is the viability filter. Path 3 (Keep & Buy) might show the highest 10-year net worth, but if it requires $3,500/month more in cash flow than you currently spend — while you're also managing a rental remotely — it's theoretically superior but practically unsustainable.
Look at:
- Which paths are cash-flow positive from the rental? If rental income covers the old mortgage (DCR ≥ 1.0), you're not subsidizing the old property from your salary
- What is the monthly cost to carry two properties? Even if rent doesn't fully cover the old mortgage, the gap may be small — and the equity build worth it
- At the destination, which housing cost (buying vs. renting) fits your budget? The destination's cost affects paths 1 vs. 2 and paths 3 vs. 4
How Each Path Is Modeled
Path 1: Sell & Buy — Sale proceeds net of 7% selling costs and remaining balance flow into the new home's down payment. You carry one mortgage at today's rates. Both the old home's potential future appreciation and your low-rate loan are gone.
Path 2: Sell & Rent — Same sale proceeds, but instead of buying at the destination, you invest the lump sum. Your rental expense at the destination grows at the rent growth rate. Net worth at year 10 = investment portfolio value.
Path 3: Keep & Buy — You carry two mortgages. The old home generates rental income, which partially or fully offsets its costs. Both properties appreciate. Net worth = combined equity in both homes. Cash flow demand is highest; complexity is highest.
Path 4: Keep & Rent — You keep the old home as a rental and rent at the destination. One mortgage (the old, cheap one). Net worth at year 10 = old home equity + savings from the investment-light path at the destination. Often the simplest and most financially compelling path for owners with low-rate mortgages and appreciating markets.
The Path Scorecard
Below the charts, each path is scored on five dimensions:
- Liquidity: How accessible is your capital if you need it?
- Cash flow: How much does this path demand monthly?
- Risk concentration: Are you overexposed to real estate, one market, or one tenant?
- Operational complexity: Does this path require managing a rental, dual utilities, tax filings?
- 10-year net worth: The financial outcome
The scorecard prevents you from choosing a path solely because of one dimension. Path 3 might win on net worth but score poorly on complexity and cash flow. Path 2 might win on liquidity but trail on 10-year wealth. The full picture requires all five.
When Each Path Makes the Most Sense
Sell & Buy (Path 1):
- Your current market is flat or declining and the new market is appreciating
- You need the equity for the new down payment (Path 3 and 4 require carrying the old mortgage without that cash)
- Managing a rental remotely is not something you want to deal with
- Your current rate isn't dramatically better than today's rates (bought 2023+)
Sell & Rent (Path 2):
- The destination is very high cost and buying doesn't make sense near-term
- You're uncertain about your tenure at the destination (< 3 years likely)
- You want maximum flexibility and liquidity for a transitional period
- The Buy vs. Rent analysis for your destination shows renting wins for your timeline
Keep & Buy (Path 3):
- Your current market has strong appreciation and rental yield
- You can manage the cash flow of two mortgages comfortably
- You want real estate in both markets for diversification or conviction
- A local property manager can handle the old home without much involvement from you
Keep & Rent (Path 4):
- You have a sub-5% mortgage on the old home — the lock-in effect is large
- Your current market has solid appreciation and rent covers or nearly covers your costs
- The destination has a favorable buy vs. rent outcome (buying makes sense)
- You want to preserve cheap leverage while building equity at the destination
Step-by-Step Walkthrough
- Enter your current home value, remaining balance, and interest rate — these drive the lock-in calculation
- Enter your current PITI payment
- Research and enter a realistic monthly rental income for the current home
- Enter the new home price and today's mortgage rate for the buying scenarios
- Enter the destination rental cost for the renting scenarios
- Set appreciation assumptions for both markets
- Review the net worth chart: which paths are leading at year 5 and year 10?
- Check the monthly cash flow chart: which paths are operationally sustainable?
- Read the path scorecard: is the leading financial path also practical given your situation?
- Factor in non-financial considerations: school districts, community stability, desire to return to the current location
Frequently Asked Questions
Can I qualify for a second mortgage while keeping my current home? Lenders evaluate your debt-to-income ratio including both mortgage payments. Rental income from the old home is typically counted at 75% of gross rent to offset the payment. A strong DTI, good credit, and 6 months of reserves for both properties are typical requirements. Pre-qualify with an investment-friendly lender before committing to Path 3.
What if I want to return to my current home in the future? Keeping the property (Paths 3 and 4) preserves this option entirely. The mortgage stays active, the property remains in your name, and you can simply stop renting it when you return. Selling eliminates this optionality permanently — and if prices rise in the interim, re-entry becomes more expensive.
How accurate is the 10-year net worth projection? The projection is a model — it uses your appreciation, rent growth, and investment return assumptions consistently. Actual results will differ. Its value is in comparing paths on equal footing, not in predicting an exact dollar figure. The sensitivity to the appreciation input is worth testing: run the analysis at both 2% and 4% appreciation to see how the path rankings change.
What are the tax implications of renting out my current home? Rental income is taxable. You can deduct operating expenses including mortgage interest, property taxes, insurance, maintenance, and depreciation (27.5-year straight-line for residential property). If you rent the home within 3 years of it being your primary residence, you may qualify for the primary residence capital gains exclusion ($250K single / $500K MFJ) when you eventually sell. Consult a CPA before committing to the keep-and-rent path.
The calculator shows Path 4 winning clearly — should I just do that? If Path 4 shows the highest 10-year net worth, has manageable cash flow, and your rental income covers or nearly covers the old mortgage, it's often genuinely the best financial path. The complicating factors: managing a rental remotely requires either a good property manager (8–12% of rent) or significant personal involvement; tenant risk is real; and liquidity in real estate is low. Model the property management fee in the inputs if you haven't — it reduces the financial advantage significantly for some deals.