The True Cost Buy vs. Rent Calculator builds a complete 30-year financial model for both paths and tracks your net worth under each scenario year by year. The answer isn't a verdict — it's a break-even year. Before that year, renting wins financially. After it, buying wins. Your planned time horizon does the rest.
What the Calculator Models
Before looking at any inputs, it helps to understand what's actually being compared:
Buying path: You spend your down payment, take on a mortgage, and start building equity through principal paydown and home appreciation. You also pay property taxes, insurance, maintenance, and interest — ongoing costs that don't build equity. When you sell, you pay 7% in transaction costs. Your net worth at any year is home equity minus those selling costs, plus whatever savings you've accumulated on the side.
Renting path: Your down payment goes into an investment account and compounds. Each month, any cost difference between renting and owning is also invested. No transaction costs, no maintenance surprises, no property tax. Your net worth at any year is your portfolio balance.
The break-even year is where the buying line crosses the renting line on the net worth chart — the minimum ownership duration for buying to outperform.
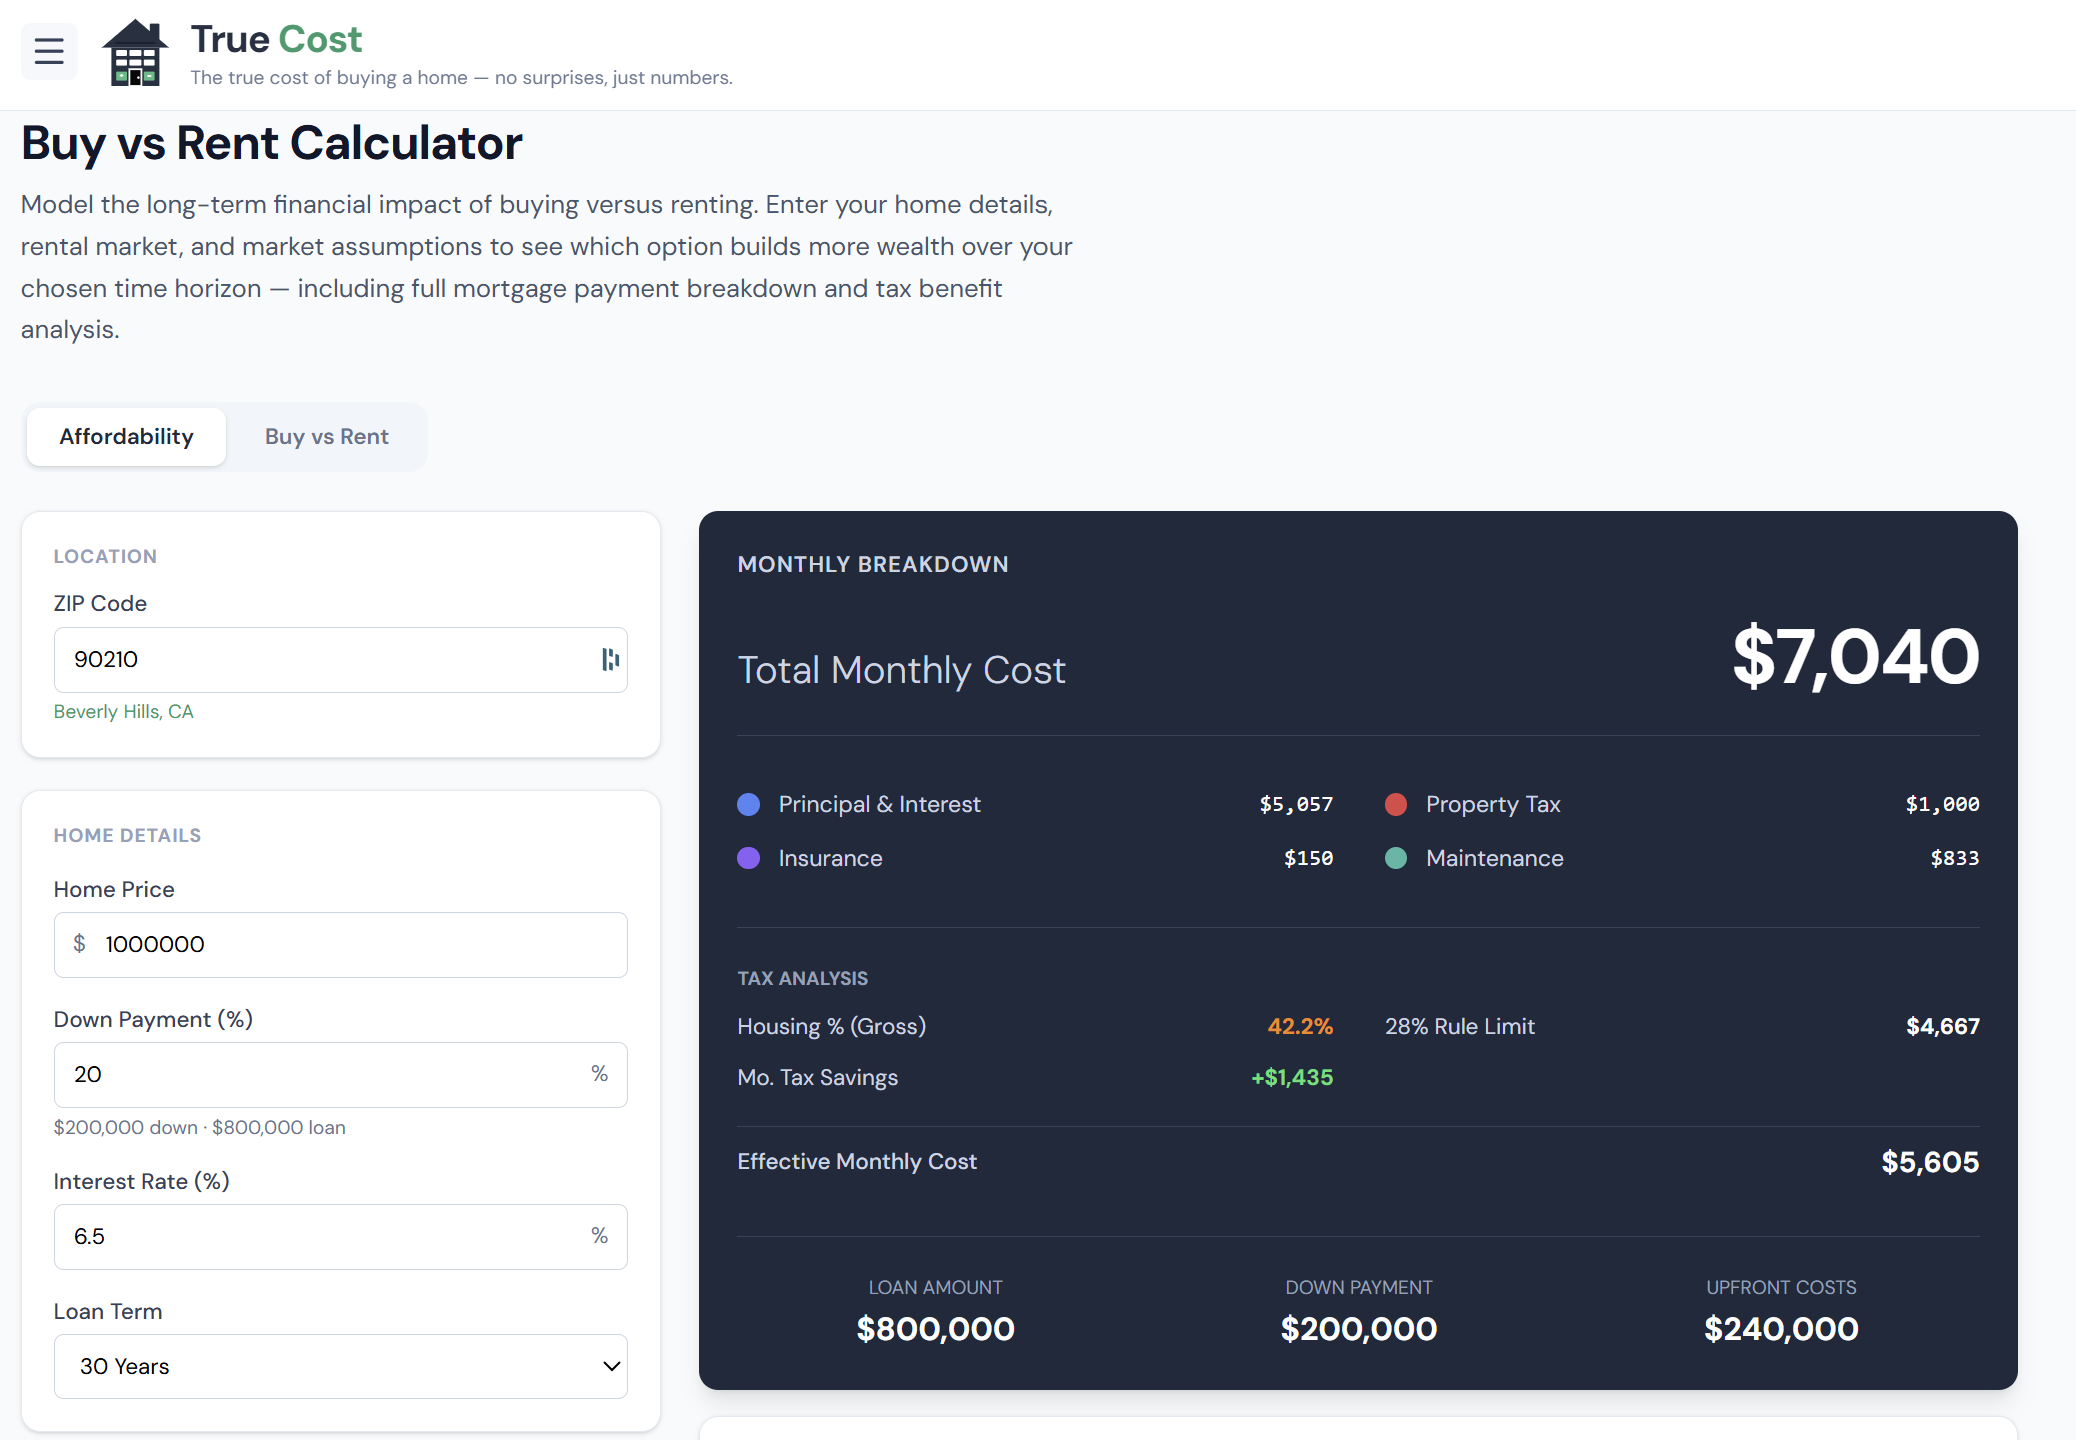
The Inputs Panel
The inputs panel is where you configure your specific scenario. Every input here has a real impact on the break-even year.
 click to enlarge
What Each Input Controls
| Input | What changes when you adjust it |
|---|---|
| Home Price | Loan amount, monthly cost, appreciation base |
| Down Payment % | Cash deployed upfront; starting investment in rent path |
| Interest Rate | P&I payment; total interest over the loan life |
| Monthly Rent | The renting path's monthly cost; how fast savings compound |
| Home Appreciation | How quickly equity grows via price gains |
| Rent Growth | How fast the renter's monthly expense rises each year |
| Investment Return | How fast the renter's portfolio compounds |
| Inflation Rate | Affects real purchasing power of both paths |
| State / Income | Determines tax deduction benefit for the buying path |
Setting the Appreciation Rate
Home appreciation is one of the most important and least predictable inputs. The national long-run average is around 3–4% per year, but local markets diverge significantly.
Use 2% if you're in a flat or declining market. Use 4–5% for historically hot markets where supply is constrained. Then run all three — the range of break-even years that results tells you how sensitive your decision is to local conditions.
Setting the Investment Return
The default of 7% reflects the long-run nominal return of a diversified equity index. If you're more conservative (bonds-heavy, near retirement), use 5–6%. If the alternative is paying off higher-rate debt, use that rate instead.
This input matters a lot: higher investment returns make buying harder to beat, because the opportunity cost of tying up the down payment in a home is higher.
The Rent Comparison
Enter what you'd pay to rent an equivalent home in your target market. If you're comparing a $550,000 purchase to a $2,800/month rental of a similar home, enter $2,800. The wider the gap between your monthly ownership cost and your rent, the longer the break-even.
The calculator auto-estimates rent from your ZIP if you've run the mortgage calculator, but you can override it with local data from Zillow, Apartments.com, or a local agent.
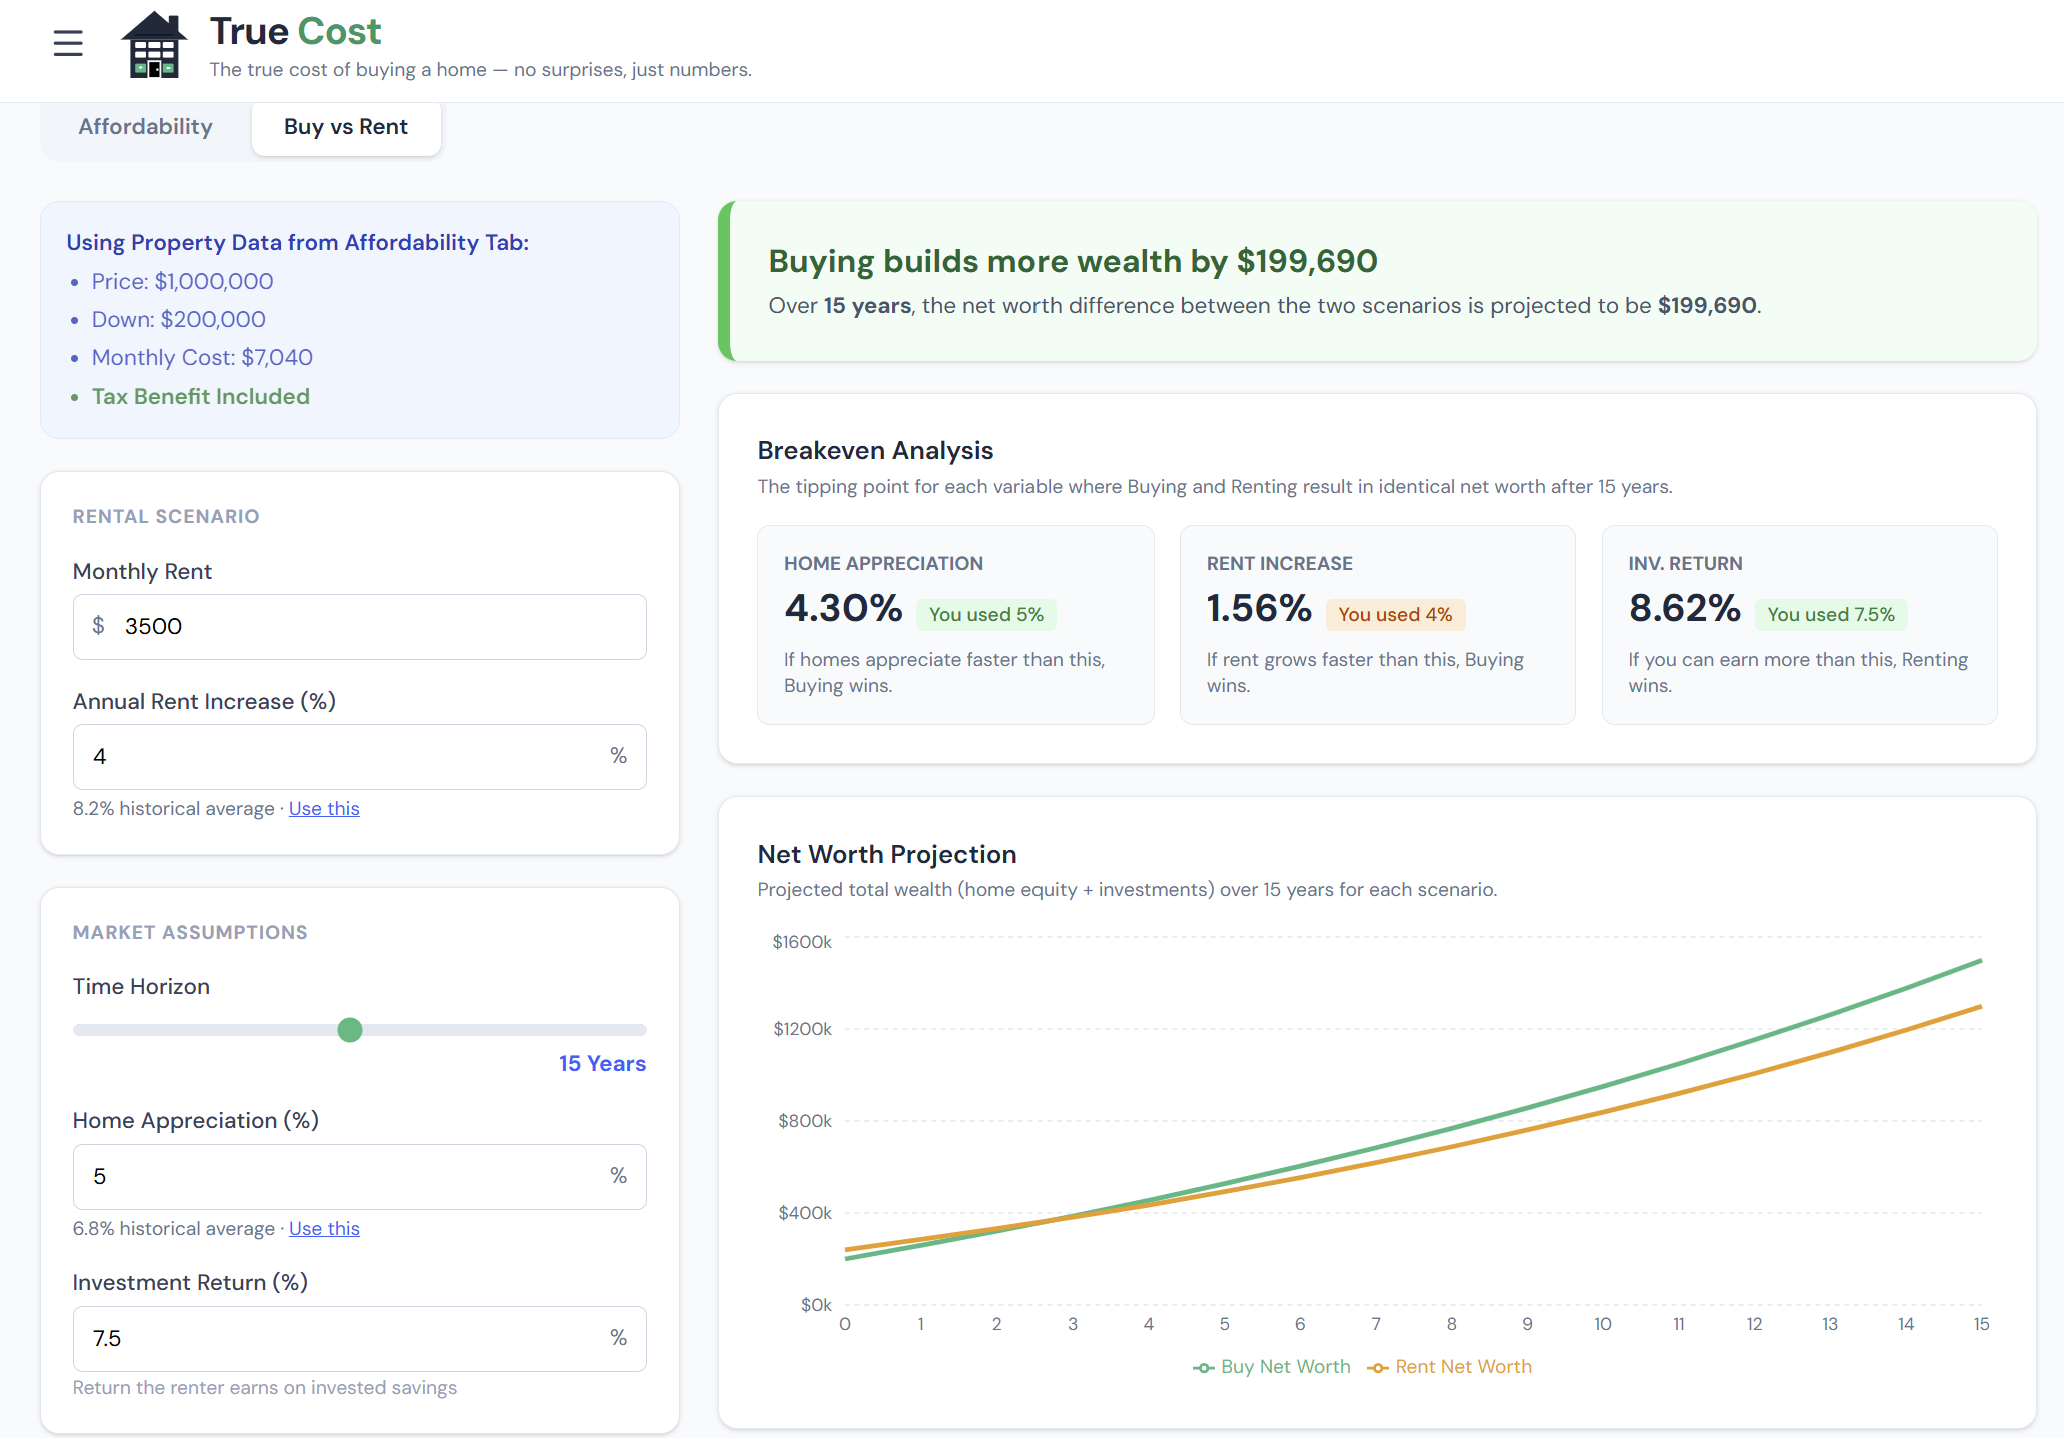
How to Read the Net Worth Chart
The net worth chart is the core output of the Buy vs. Rent Calculator. It plots buying vs. renting wealth year by year over the full 30-year horizon.
Reading the chart:
- The buying line starts negative (you spent the down payment and closing costs) and curves upward as equity builds
- The renting line starts positive (your down payment is invested) and grows steadily with compound returns
- Where the lines cross = your break-even year
- The vertical distance between the lines at any year = the wealth advantage of the leading path at that point
At year 10 and year 30, look at the dollar gap. A 30-year advantage of $150,000 for buying is substantial; a $20,000 advantage is slim enough that non-financial factors (flexibility, stability, school districts) should weigh heavily.
The Break-Even Year as a Decision Tool
The break-even year isn't a verdict — it's a decision threshold. Here's how to use it:
If break-even is at year 7:
- Staying 10+ years → buy with confidence
- Staying 5–6 years → renting is safer; close either way
- Staying 3 years → rent; buying doesn't recover the transaction costs in time
If break-even is "never" (>30 years):
- Renting and investing dominates across the full simulation horizon
- This is common in high-price, low-rent markets (coastal metros with high home prices relative to rents)
- Buying may still make sense for non-financial reasons — but understand it's a lifestyle choice, not a wealth-building move in this scenario
If break-even is at year 2–3:
- Buying is very financially efficient; even short stays benefit from ownership
- More common in markets with low prices relative to rents (parts of the Midwest and South)
Key Assumptions to Know
The model uses these fixed assumptions — awareness of them helps you interpret results correctly:
- Selling costs: Fixed at 7% of home value (agent commissions, closing costs, transfer taxes) applied at every potential exit year
- PMI: Included in ownership cost until your equity reaches 20%
- Tax deduction: Only the marginal amount above the standard deduction benefits you ($30,000 MFJ threshold in 2026; SALT cap at $10,000)
- Investment compounding: Monthly, tax-deferred (approximates a broad index fund in a tax-advantaged account)
- Both scenarios assume you never pre-pay the mortgage — for extra payment scenarios, see the Extra Payments tab in the main calculator
What Makes This Calculator Different from Others
Opportunity cost is fully modeled. The down payment isn't treated as "money you'd have spent anyway." It's invested in the renting scenario, and its compound growth is tracked month by month. This is the single most important modeling decision in any buy-vs-rent tool.
Tax benefits are income-specific. The mortgage interest deduction value depends on your marginal rate and whether you exceed the standard deduction. The calculator uses your actual income, filing status, and state — not a generic "you save 25% on interest" assumption.
Multiple sensitivity inputs. You're not locked into one appreciation rate or one investment return. Adjust them freely and watch the break-even shift in real time. This is how you understand the range of outcomes rather than betting on a single forecast.
No agenda. The calculator has no incentive to nudge you toward buying (it doesn't sell mortgages). If renting wins financially in your scenario, it says so.
Step-by-Step: Running Your First Analysis
- Enter your home price and down payment percentage
- Enter the mortgage rate from your pre-approval or current market quotes
- Enter the monthly rent for a comparable home in your target area
- Review the appreciation default (3% is reasonable for most markets; adjust for your specific market)
- Keep the investment return at 7% unless you have a specific alternative use in mind
- Enter your state and income for a tax-adjusted comparison
- Read the break-even year and locate it on the chart
- Ask: "Do I plan to stay longer than that?" — your answer determines the financial outcome
Frequently Asked Questions
Why does the calculator show renting wins when I'm building equity? Equity build is real, but you're also paying interest, taxes, insurance, and maintenance — costs a renter doesn't face. Meanwhile, the renter invests the down payment and monthly savings. In markets with high home prices relative to rents, those combined renting advantages can outpace equity build for many years.
What appreciation rate should I use for my city? Check Zillow's Home Value Index for your metro over the last 10 years. Take the annualized average, then haircut it slightly for forward-looking conservatism — past appreciation doesn't repeat perfectly. Run your analysis at that rate, plus 1% above and 1% below, to see how sensitive your break-even is.
The break-even is past 30 years — does that mean I should never buy? Financially, it means renting and investing produces more wealth over the simulation horizon under those assumptions. But homeownership has real non-financial value: stability, control over your space, school district access, forced savings discipline, and community roots. "Never breaks even financially" doesn't mean "wrong decision" — it means "understand you're trading some financial return for non-financial benefits."
How does a different loan term (15 vs. 30 years) affect the break-even? A 15-year loan has higher monthly payments but builds equity much faster and pays dramatically less total interest. Equity accumulates faster on the buying side, which generally shortens the break-even year. The 30-year loan has lower monthly payments, which means the renting path's investable savings are smaller — partially offsetting the slower equity build. The net effect varies by scenario; try both and compare.
Can I use this for a condo, townhouse, or investment property? The model works for any residential property. For condos, include your HOA fee in the ownership costs — it's a significant factor that shifts break-even. For investment properties (where you're the landlord, not the occupant), the Investment Property Analyzer is the better tool, since it models cap rate, IRR, and rental income directly.