The suite has six interconnected tabs, each illuminating a different dimension of the home-buying decision — from the real monthly cost of ownership to 30-year wealth projections to the math behind extra payments, discount points, and refinancing. Every tab shares the same loan so you don't re-enter your data, and every input you change ripples through the full analysis.
This guide walks through every tab, every input, and every chart — so you can get the most out of the calculator and understand exactly what the numbers mean.
 click to enlarge
Table of Contents
- Simple vs. Advanced Mode
- Tab 1: Mortgage Calculator — Your Real Monthly Payment
- Tab 2: Buy vs. Rent — The 30-Year Net Worth Model
- Tab 3: Detailed Cost Breakdown — True Cost of Ownership
- Tab 4: Extra Payments — Model Early Payoff
- Tab 5: Mortgage Points — When to Buy Down Your Rate
- Tab 6: Refinance — Break-Even Analysis
- How the Tabs Work Together
- Frequently Asked Questions
Simple vs. Advanced Mode
Before diving into the tabs, it's worth knowing that the calculator has two modes.
Advanced Mode (the default) gives you the full suite: all six tabs, every input, every chart. It's designed for buyers who want to model their specific situation in depth.
Simple Mode strips everything back to the core affordability question — home price, income, down payment, rate — and returns a quick verdict. No charts, no tabs. It's useful for quick sanity checks or sharing with someone who just needs a number.
 click to enlarge
You can toggle between modes at any time without losing your inputs. The "Simple Version" button appears in the top-right corner of the page.
Tab 1: Mortgage Calculator — Your Real Monthly Payment
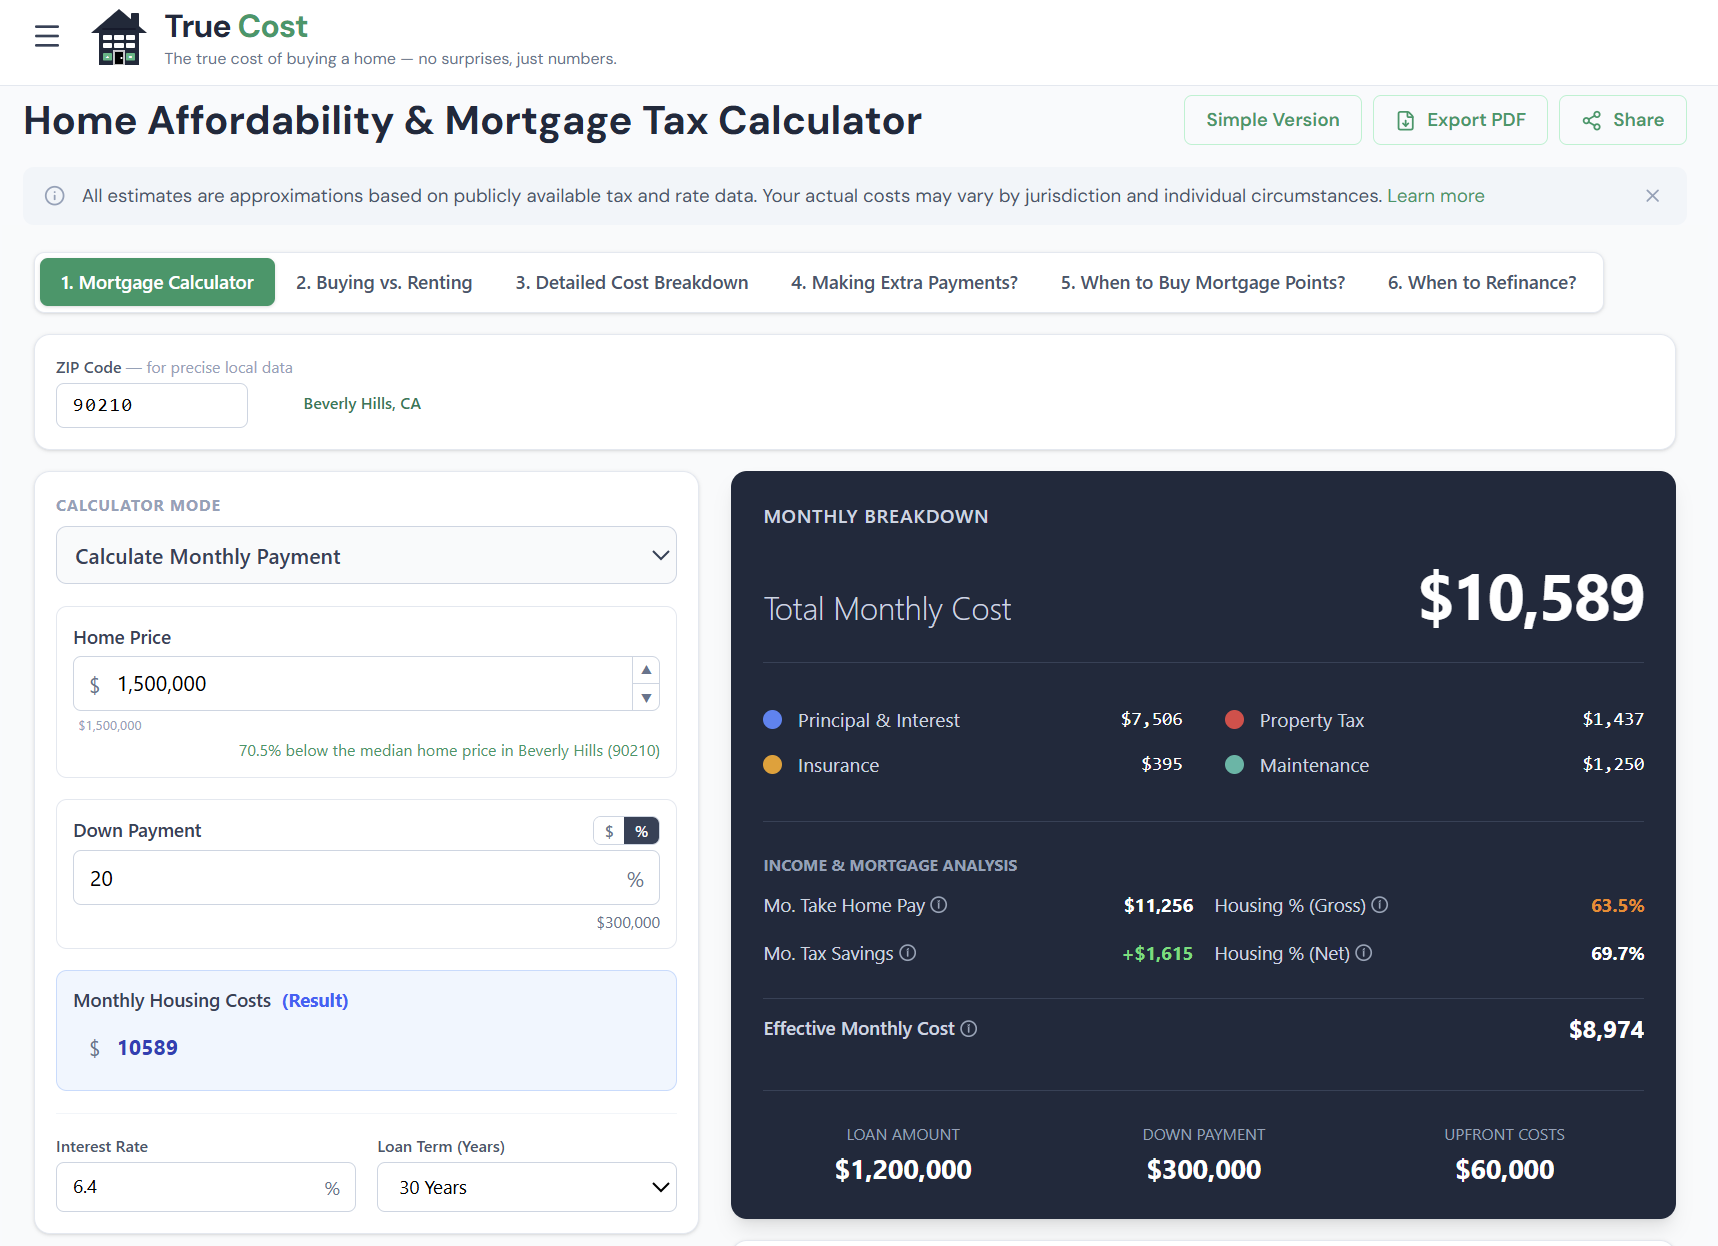
The first tab is the foundation of the suite. It answers the question most calculators get wrong: not just what your principal and interest payment is, but what you'll actually pay each month to own this home.
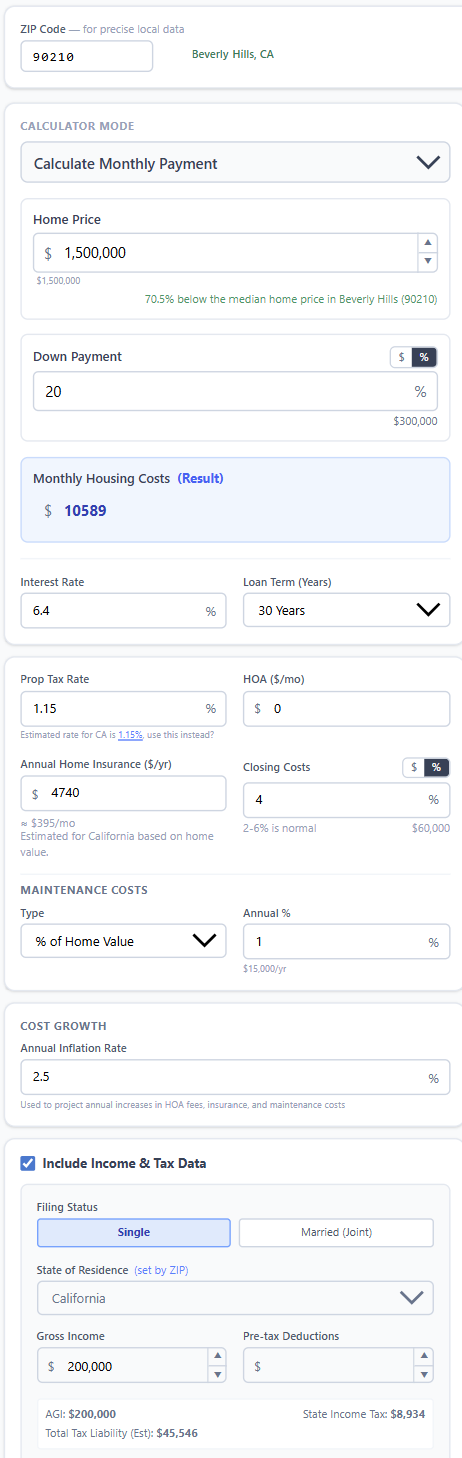
The Inputs Explained
The left panel contains all the inputs the calculator needs. Here's what each one does:
 click to enlarge
| Input | What it controls | Notes |
|---|---|---|
| Home Price | The purchase price | Your offer or target budget |
| Down Payment | % or $ upfront | Below 20% triggers PMI |
| Interest Rate | Annual mortgage rate | Use your pre-approval or current market rate |
| Loan Term | 15 or 30 years | 30yr is default; 15yr saves interest, raises payment |
| ZIP Code | Local tax & insurance | Auto-fills property tax rate + insurance estimate |
| HOA | Monthly association fee | Enter 0 if none |
| Annual Maintenance | Upkeep budget | Default 1% of home value per year |
| Gross Annual Income | For DTI calculation | Household total, pre-tax |
| Monthly Debts | Car, student loans, etc. | For back-end DTI |
The ZIP code field is where the True Cost Calculator distinguishes itself from most tools. Instead of using a national average property tax rate (typically a meaningless 1.1%), it looks up actual effective tax rates by ZIP code, county, and state. A home in Texas comes back with a 2.2–2.5% effective rate; a home in Hawaii shows under 0.3%. That difference is worth hundreds of dollars per month — and most calculators miss it entirely.
What the Results Show
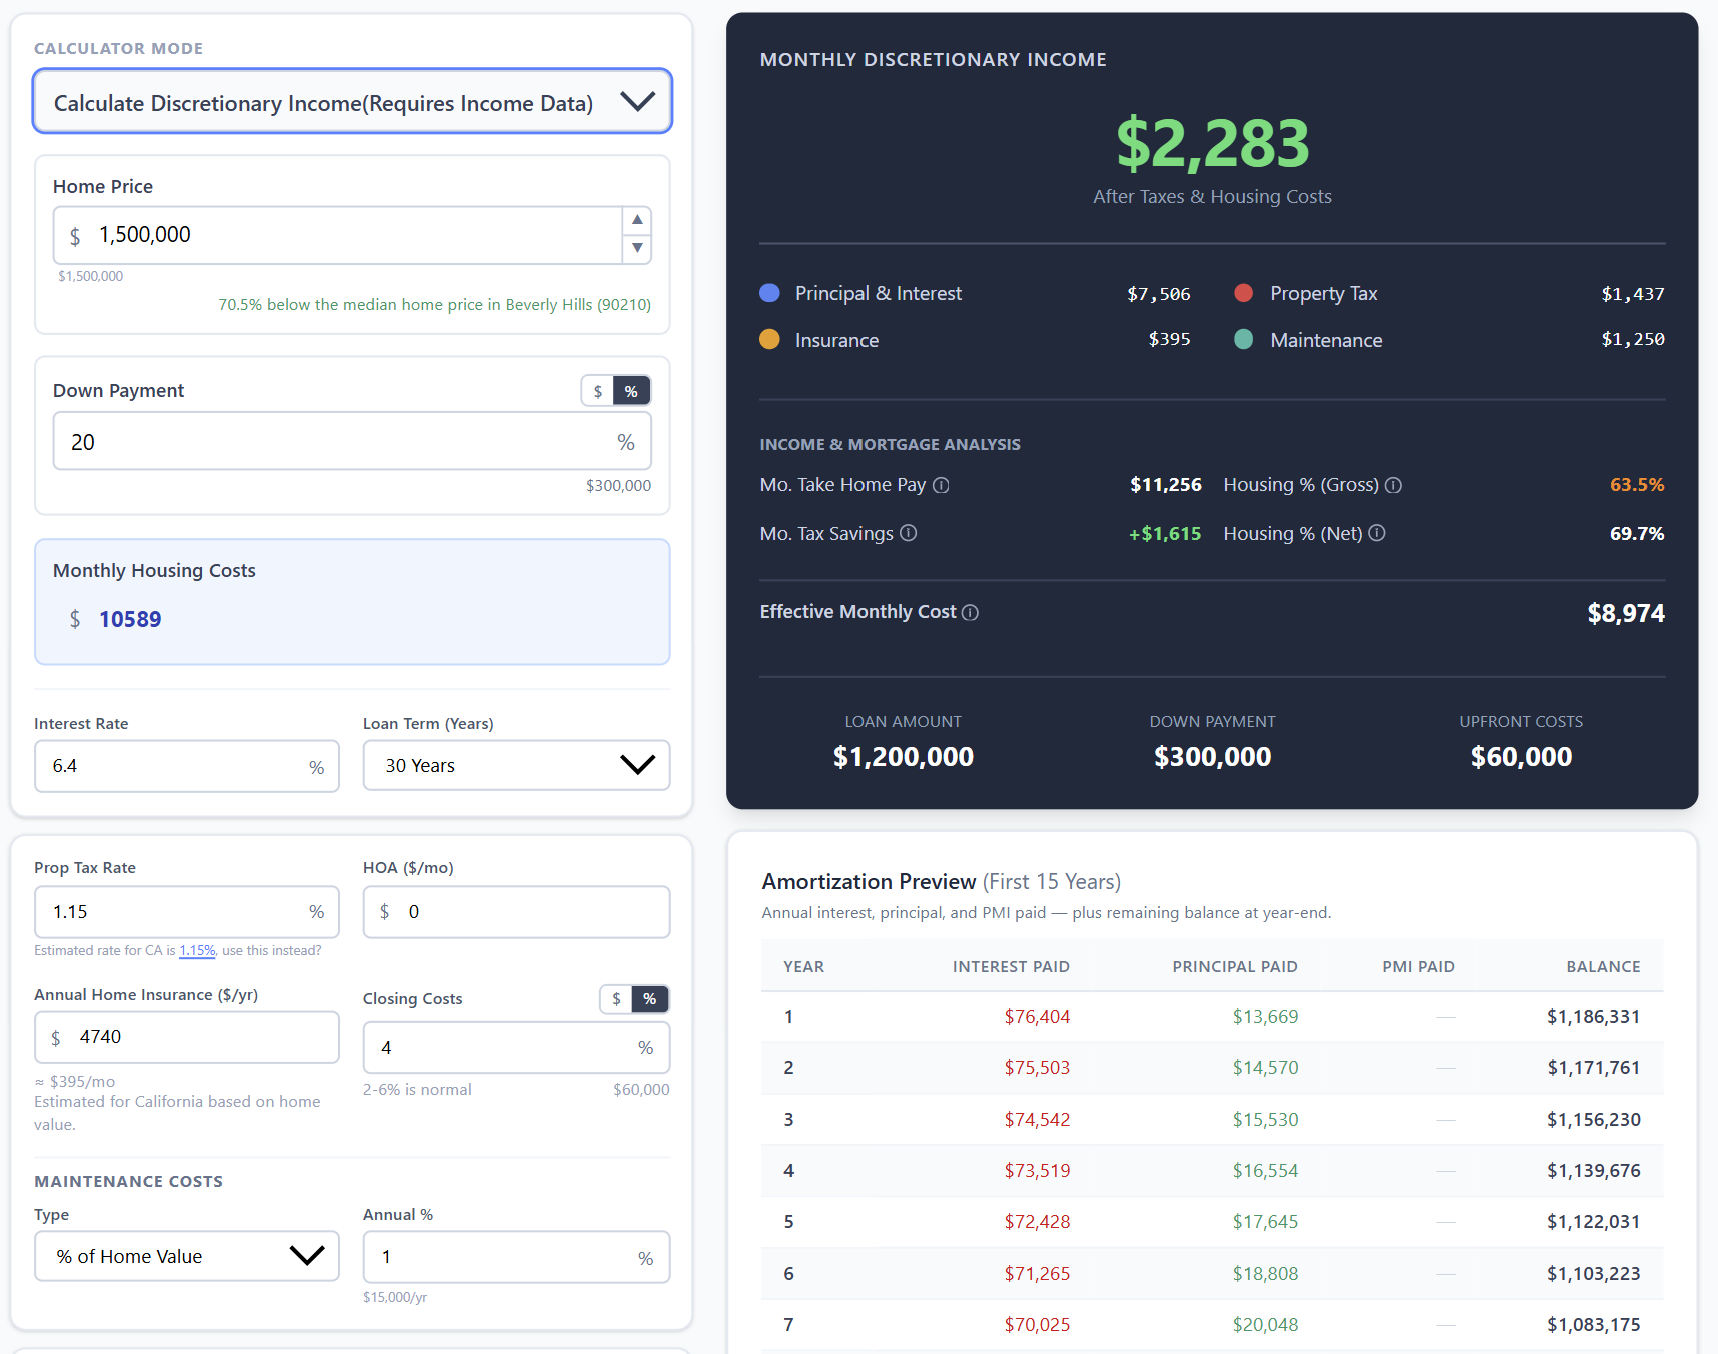
Once your inputs are set, the results panel shows a full breakdown of your monthly housing costs:
 click to enlarge
Your monthly total isn't just P&I — it's the sum of all six components:
- Principal — The portion of your payment that reduces your loan balance
- Interest — The cost of borrowing; highest in month 1, slowly decreasing over time
- Property Tax — Your annual tax divided by 12, auto-calculated from ZIP data
- Homeowners Insurance — Regional estimate; override with your actual quote
- PMI — Only if your down payment is under 20%; typically 0.5–1% of loan annually
- HOA + Maintenance — Your entries; these don't change with the loan
The affordability verdict uses two thresholds from conventional lending guidelines:
- Front-end DTI: Housing costs ÷ gross income. Under 28% = Affordable.
- Back-end DTI: (Housing costs + all debt payments) ÷ gross income. Under 43% = Affordable.
The verdict can be Affordable, Stretch (approaching the limits), or Over Limit (exceeds conventional guidelines). These are guidelines, not hard rules — lenders may go higher with strong credit and reserves.
Discretionary Income View
Below the affordability verdict, the calculator shows how your housing costs interact with your overall budget — including the after-tax income actually available after housing, taxes, and existing debts.
 click to enlarge
This view is particularly useful for buyers who are technically within DTI limits but feel cash-squeezed. If your housing costs leave $800/month in discretionary income, that's a very different lifestyle than the same DTI leaving $3,000/month.
Tab 2: Buy vs. Rent — The 30-Year Net Worth Model
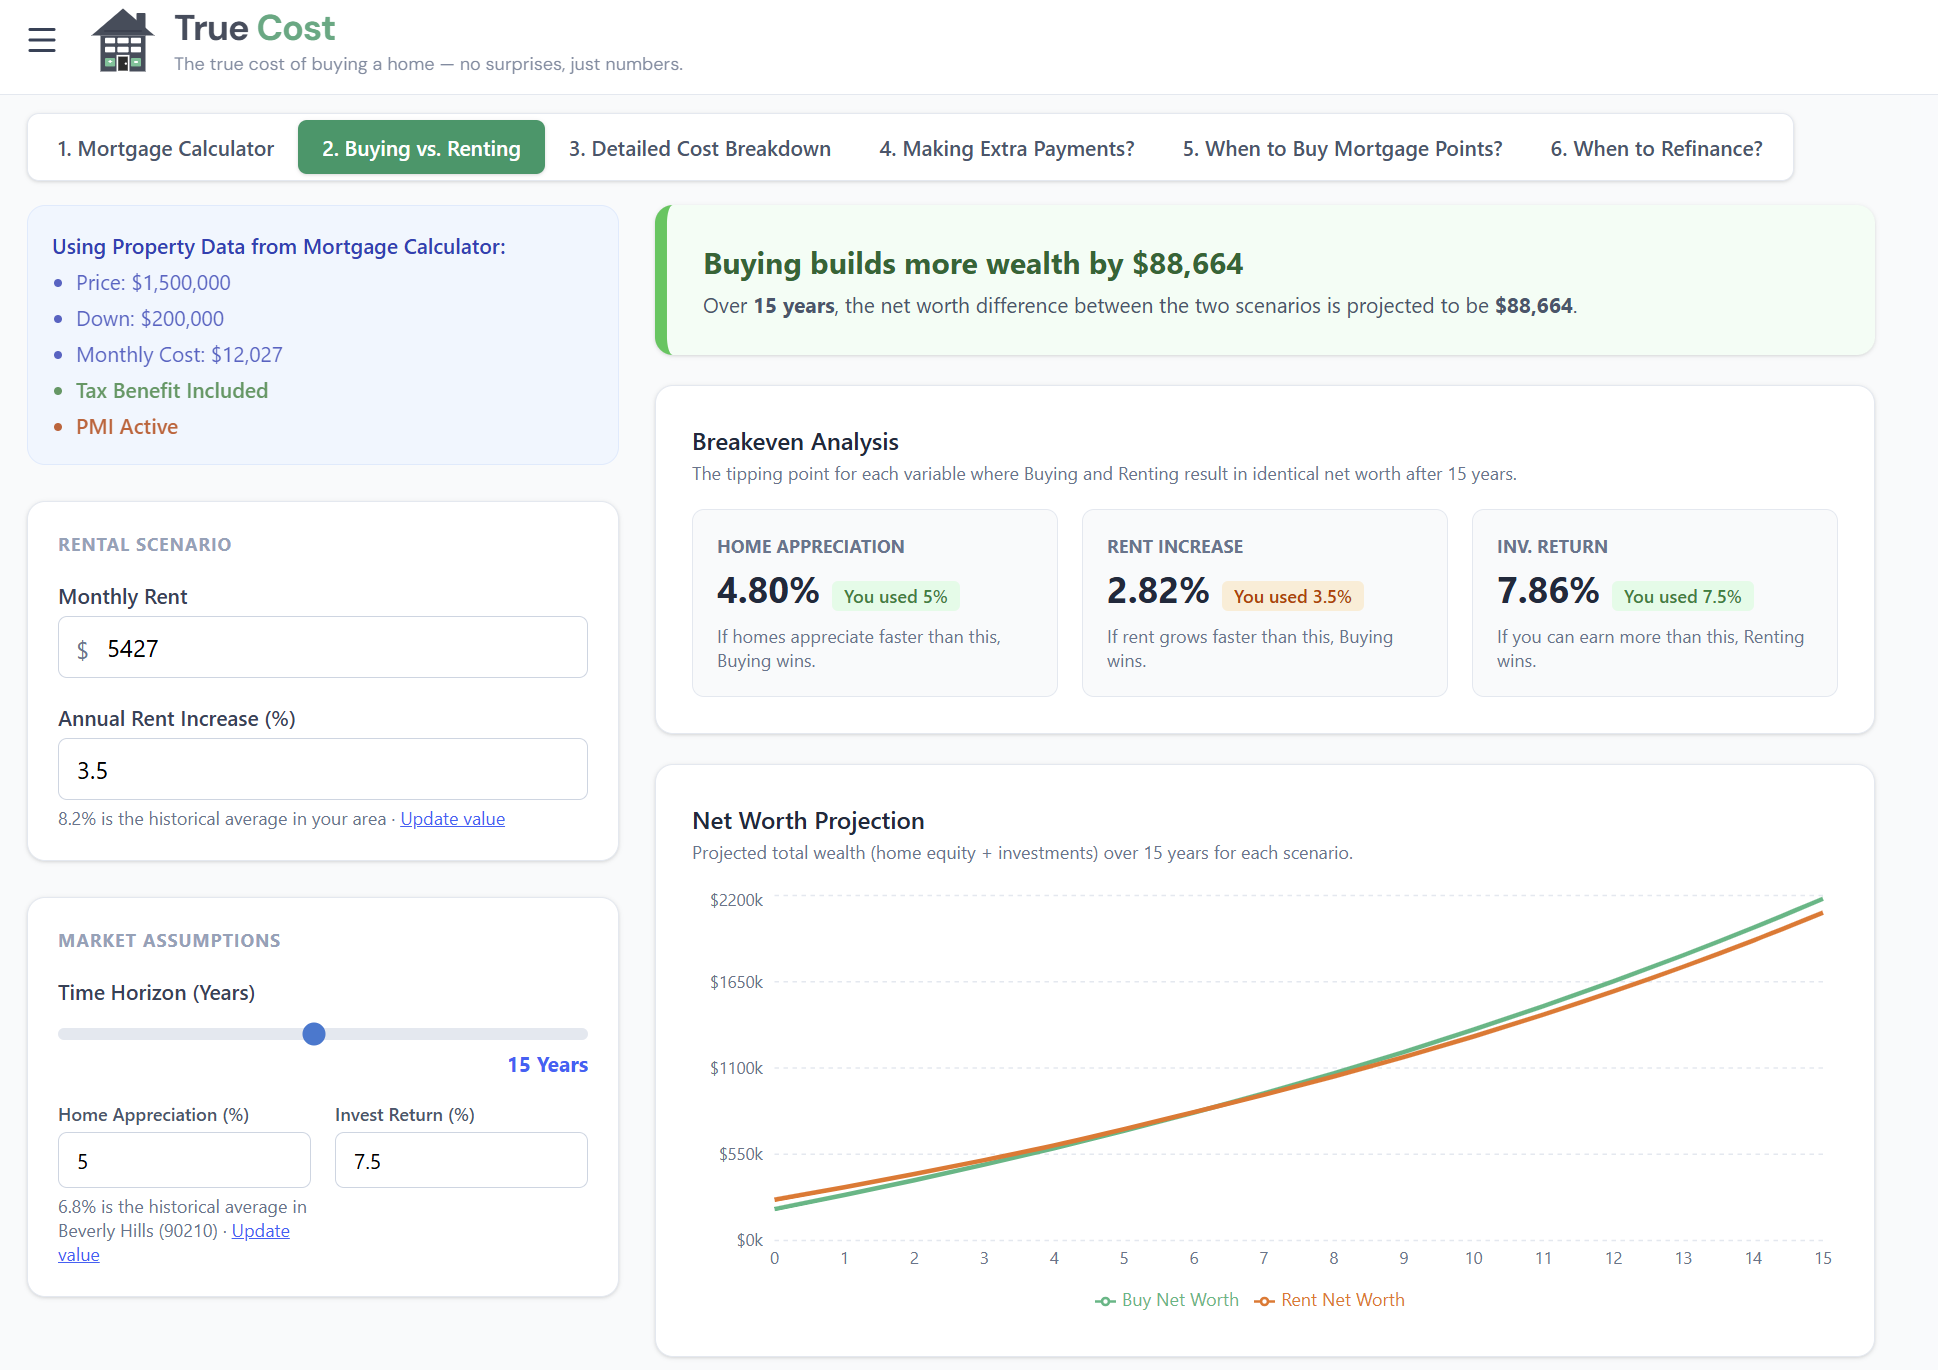
The Buy vs. Rent tab answers the question the mortgage tab doesn't: would you be wealthier renting and investing instead?
Most buy-vs-rent comparisons are shallow — they compare your mortgage payment to your rent and declare a winner. This model is different. It runs two parallel financial simulations over 30 years and tracks your projected net worth under each path.
 click to enlarge
What the Model Tracks
If you buy:
- Equity builds month by month through principal paydown and home appreciation
- Tax benefits from mortgage interest deduction reduce net cost (where applicable)
- Selling costs (7% of home value) are applied at each exit point
- Maintenance, HOA, and insurance are ongoing drains on wealth
If you rent:
- Your down payment is invested at your chosen rate of return
- Each month, any cost difference between renting and owning is also invested
- Your portfolio compounds over time without the drag of maintenance and selling costs
The break-even year is where the two lines cross — the minimum time you'd need to stay for buying to produce more wealth than renting. Before that year, renting wins. After it, buying wins.
Key Variables That Shift the Break-Even
Three inputs have an outsized impact on the result:
- Appreciation rate: Every 1% more in annual appreciation can cut the break-even by 2–4 years in most markets. Try 2%, 3%, and 5% to see the range.
- Investment return: Higher returns on the renting path's invested capital make buying harder to beat. The default 7% reflects long-run stock market returns.
- Monthly rent: If your rent is very low relative to owning, renting wins more easily. If rent is close to (or above) your ownership cost, buying looks better faster.
The break-even year is not a verdict — it's a decision threshold. If you're planning to stay 12 years and break-even is at year 8, buying is the financially stronger choice. If you're unsure how long you'll stay, the chart shows you exactly what you're risking at each horizon.
Tab 3: Detailed Cost Breakdown — True Cost of Ownership
The Detailed Cost Breakdown tab goes beyond the monthly payment into the full lifecycle of ownership. It has two sub-tabs: Net Worth and Tax Benefit.
Net Worth Sub-Tab: Where Every Dollar Goes
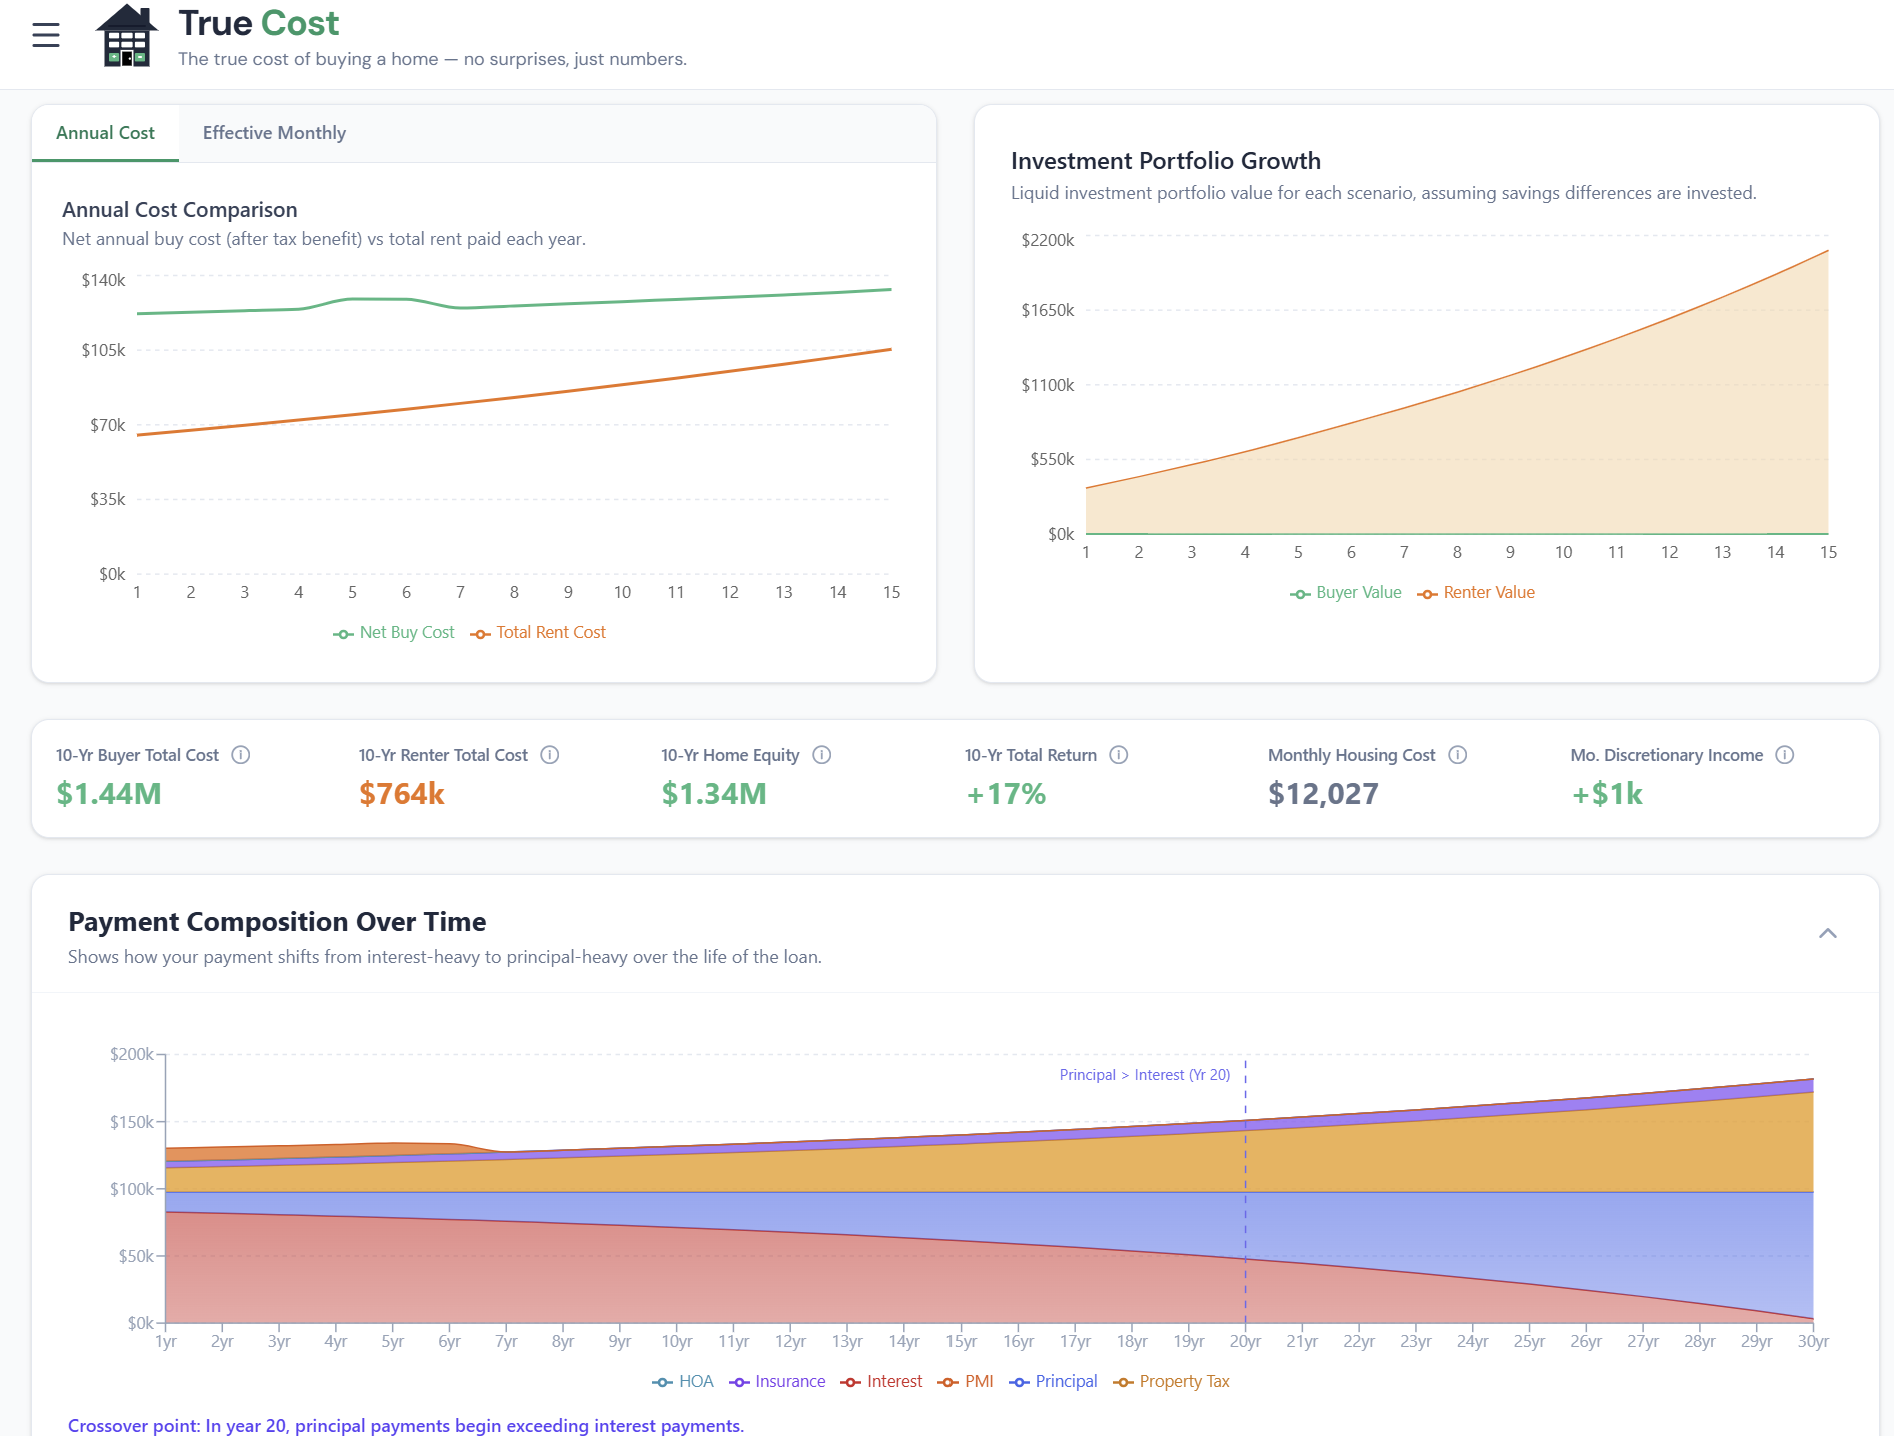
The payment composition chart shows the split between principal, interest, tax, insurance, HOA, and maintenance — for every year of the loan.
In year 1 of a 30-year mortgage at 7%, roughly 80% of your P&I payment goes to interest and only 20% to principal. By year 15, that split has reversed. By year 25, nearly all of each payment is principal. The chart makes this shift visible — which is why it often surprises people.
The amortization preview table shows the year-by-year numbers for the first 15 years (or your full loan term if shorter): beginning balance, annual principal, annual interest, cumulative interest paid, and equity including appreciation. Use it to see exactly how much interest you'll have paid by any year you might sell.
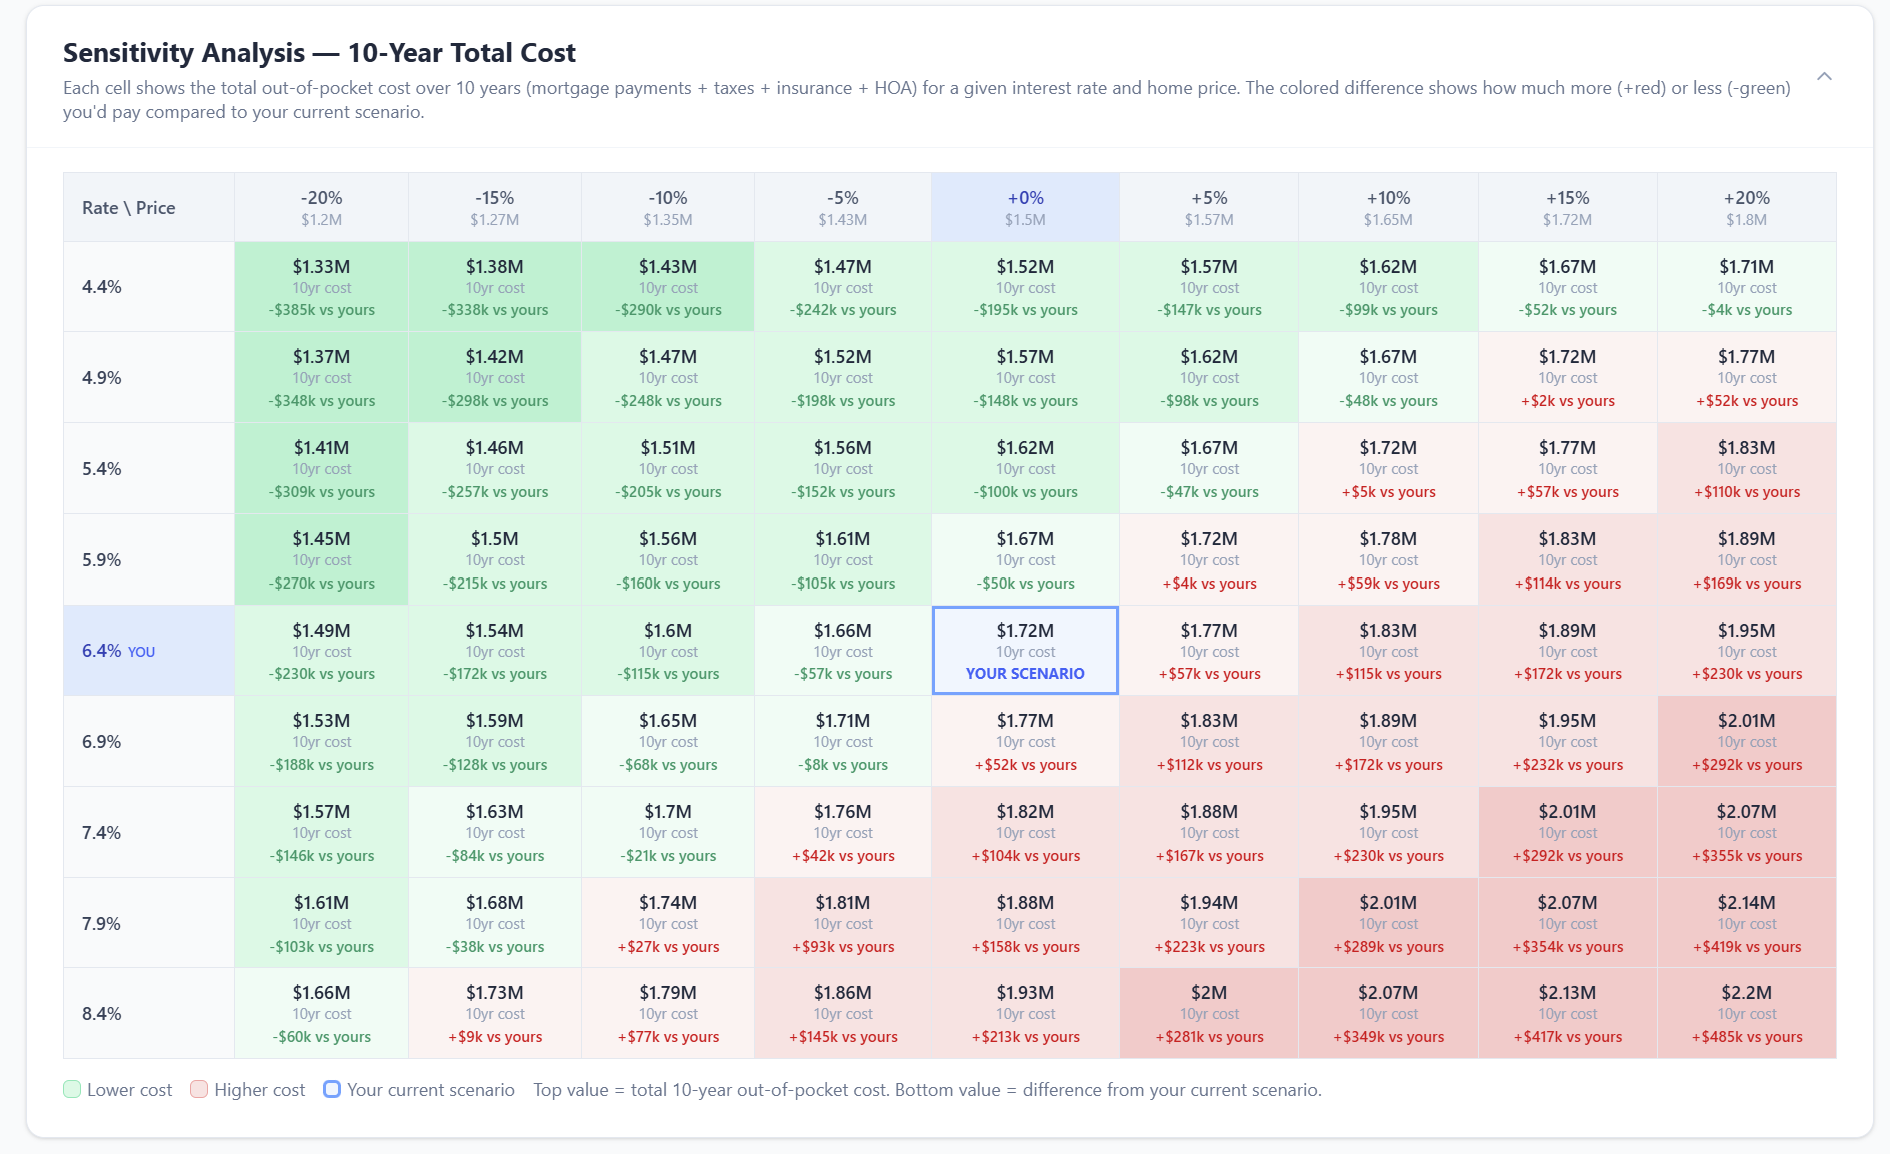
Sensitivity Analysis
 click to enlarge
The sensitivity table lets you stress-test one key variable — typically appreciation — to see how robust your break-even is. If break-even is 7 years at 3% appreciation but 12 years at 2% appreciation, your decision to buy is sensitive to local market conditions. If it's 7 years at both 2% and 4%, you have a more confident case for buying.
Tax Benefit Sub-Tab: What the Deduction Is Actually Worth
The tax sub-tab only appears when you've set a state of residence and income. When it does, it shows something most calculators completely ignore: the deduction shrinks every year.
Here's why: mortgage interest decreases as your balance falls. By year 15, your annual interest payment may be 30–40% lower than in year 1. Meanwhile, the standard deduction ($30,000 for married filing jointly in 2026) is fixed. At some point — for many borrowers, well before the loan is paid off — your itemized deductions fall back below the standard deduction, and the mortgage interest benefit goes to zero.
The tax sub-tab shows the crossover year, the year-by-year deduction value, and your effective after-tax rate — what your mortgage actually costs you after the government subsidy.
Tab 4: Extra Payments — Model Early Payoff
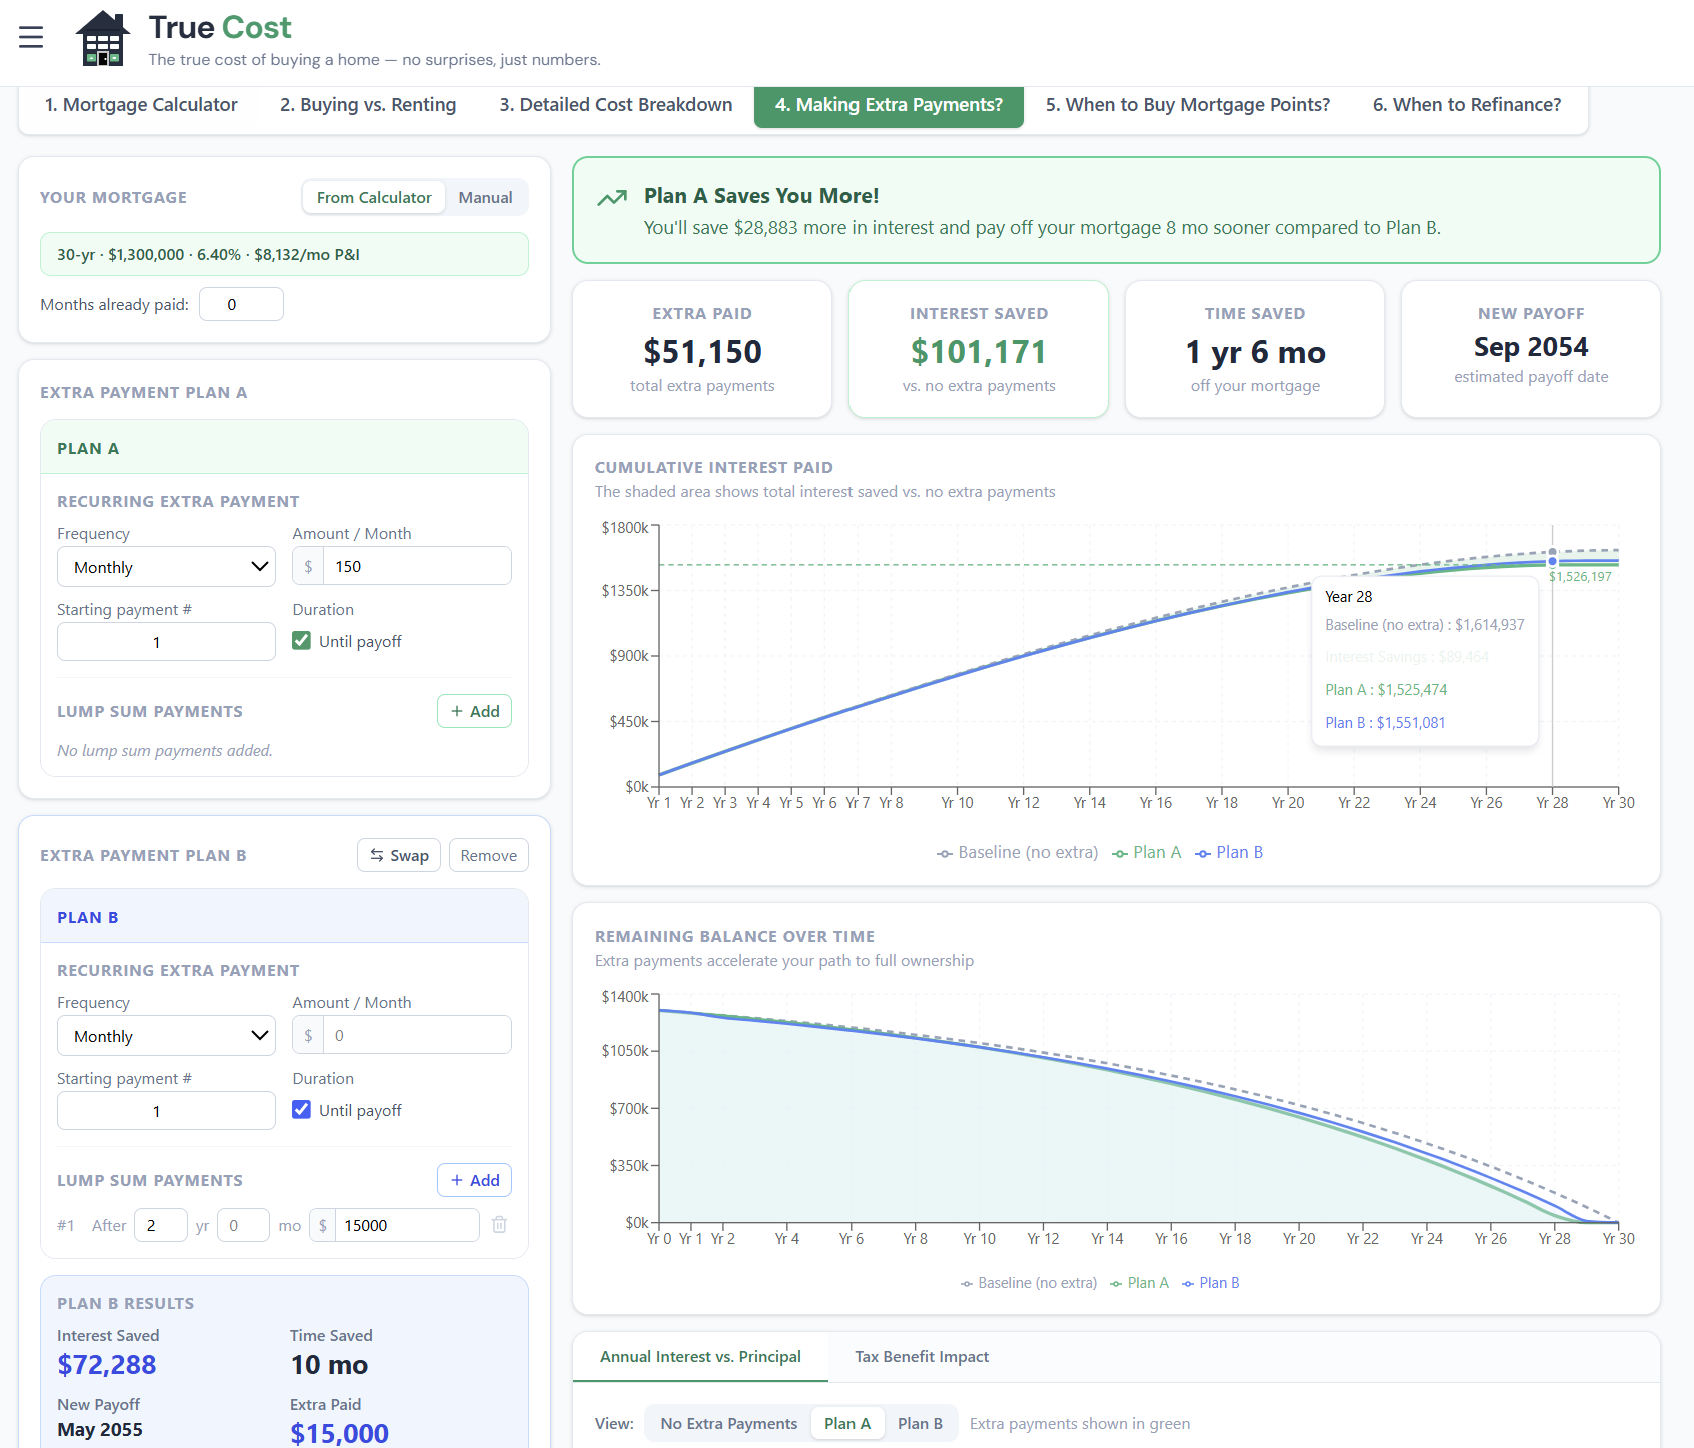
The Extra Payments tab models what happens when you pay more than required each month. The results are dramatic — often tens of thousands in saved interest and years off your loan term — but the tab is built around a more precise question: is paying extra the best use of that money?
 click to enlarge
Two-Plan Comparison
You can model up to two extra payment plans — Plan A and Plan B — and compare them side by side. Each plan specifies:
- Extra amount per period (how much above your regular P&I)
- Payment frequency (monthly, bi-weekly, weekly, annual lump sum, or one-time)
- Start month (when you begin making extra payments)
This setup lets you compare scenarios like "$300/month extra" vs "$3,000 annual lump sum" — or "extra $200/month starting now" vs "extra $500/month starting in 3 years."
The IRR: Comparing Extra Payments to Investing
The most important output isn't the payoff date or even the interest savings — it's the IRR (Internal Rate of Return). This is the annualized return you're earning on your extra payments, expressed as a percentage.
Think of it this way: if your mortgage is at 7% and your extra payment IRR is 6.9%, extra payments and investing the same money in an index fund produce essentially equivalent financial outcomes — but extra payments are risk-free. At a 7.5% IRR, extra payments clearly win on risk-adjusted terms. At 5.5%, the market probably beats extra payments — though the psychological value of being debt-free isn't in the formula.
The frequency sensitivity table (collapsible, below the main results) shows the same extra dollar amount across every payment frequency. Bi-weekly payments — 26 half-payments per year instead of 12 monthly ones — are particularly effective because they sneak in a 13th full monthly payment per year, typically eliminating 4–6 years from a 30-year mortgage with no change to your monthly budget.
Tab 5: Mortgage Points — When to Buy Down Your Rate
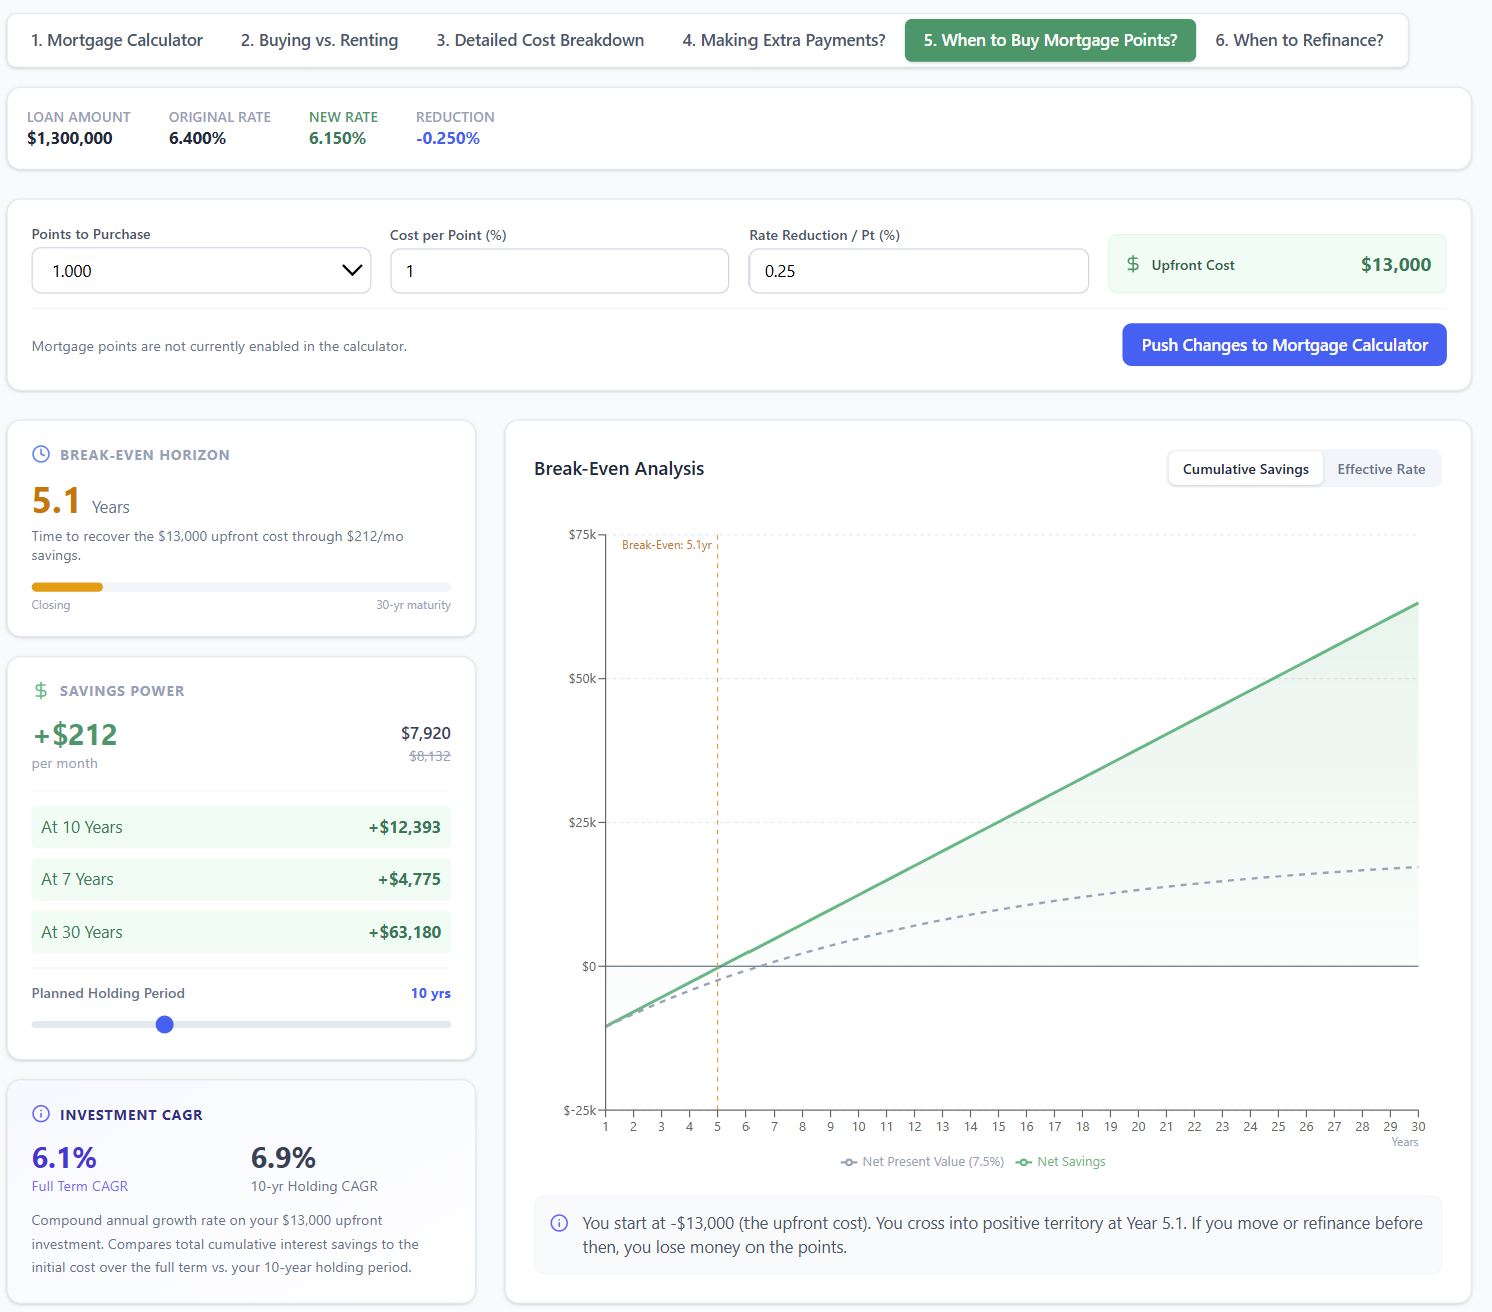
The Mortgage Points tab is a sandbox — it lets you explore whether buying discount points at closing makes financial sense, without touching your main loan calculation.
 click to enlarge
How Points Work
One mortgage discount point costs 1% of your loan amount and typically reduces your interest rate by 0.20–0.25%. On a $400,000 loan:
- 1 point costs $4,000
- Rate drops from, say, 7.00% to 6.75%
- Monthly P&I drops by about $67
- Break-even: $4,000 ÷ $67 = 60 months (5 years)
If you stay in the home longer than 60 months, you've made money. If you sell or refinance before 60 months, you've paid for nothing.
Sandbox Mode
The tab syncs from your main calculator on your first visit, then becomes independent. Adjust the number of points, cost per point, and rate reduction to explore different scenarios. The break-even month, monthly savings, and net savings at 5/10/30-year horizons all update instantly.
When you find a scenario you want to apply — say, 1.5 points at a 0.375% rate reduction — click Push Changes to Mortgage Calculator and that adjusted rate flows through to every other tab: the Buy vs. Rent comparison, the Detailed Breakdown, the Extra Payments analysis, all of it.
The opportunity cost calculation is also factored in: the calculator shows you a time-value-adjusted break-even that accounts for what that point cost could have earned if invested instead.
Tab 6: Refinance — Break-Even Analysis
The Refinance tab is where you model whether a rate refinance makes financial sense. Enter your current loan details (balance, rate, remaining term) and the new offer (rate, term, closing costs), and it returns your break-even month — the point at which cumulative savings cover the up-front cost.
For the full walkthrough of this tab — including how term resets affect total interest, cash-out refinancing, and when refinancing isn't worth it — see the dedicated Refinance Calculator Guide.
How the Tabs Work Together
The True Cost Calculator is designed as a system, not six separate tools. One set of inputs. Six views of the same decision.
A typical workflow looks like this:
- Start in Tab 1 — enter your price, rate, ZIP, and income. Get your real monthly cost. Check if you're in the affordable range.
- Move to Tab 2 — look at the break-even year. If you're planning to move in 4 years and break-even is at year 9, renting is probably the stronger financial move. If you're planning to stay 15 years and break-even is at year 7, buying wins clearly.
- Open Tab 3 — check the tax benefit. If you're in the 22% bracket and you're only marginally above the standard deduction, the deduction may be worth less than you assumed.
- Check Tab 5 first if you're shopping lenders — model whether paying 1 point for a lower rate makes sense before you lock. Push the better scenario back to the main calc before comparing tabs.
- Visit Tab 4 if you're planning to pay extra — understand the IRR, pick your frequency, see when you'd be free and clear.
- Use Tab 6 when rates drop — enter the new offer and check the break-even month before calling the lender back.
Every input change on any tab updates the underlying loan shared by the full suite. Change your down payment in Tab 1 and the buy-vs-rent chart in Tab 2, the amortization table in Tab 3, and the points break-even in Tab 5 all update immediately.
Frequently Asked Questions
Why does the True Cost Calculator show a higher monthly cost than other calculators? Because it includes property tax, homeowners insurance, HOA, and maintenance — not just principal and interest. These "other" costs typically add 30–60% on top of the P&I payment. A $2,000 P&I payment in Texas might be $3,100 total once taxes and insurance are factored in.
How accurate is the ZIP-code property tax estimate? The calculator uses a database of effective tax rates by ZIP, county, and state. It's accurate for the vast majority of U.S. locations, though assessed value (what your county taxes) can differ from purchase price (what you paid). If you know your exact tax bill, enter it as an override.
Do I need to fill in all the inputs to use the calculator? No. The mortgage payment calculation works with just home price, down payment, rate, and term. ZIP, income, and state are needed for tax-adjusted outputs and local data. Extra Payments needs a loan to work from. Everything else is optional and progressive — add more inputs, get more precision.
How often is the data updated? The ZIP-code tax and insurance data is updated periodically from publicly available assessor records. The tax bracket data uses 2026 federal and state rates. Mortgage rates are entered by you (not auto-fetched), so you should use your actual lender quote.
Can I save my inputs and come back later? Yes — the calculator automatically saves your inputs to your browser's local storage. When you return to the page, your scenario will be restored exactly as you left it. Nothing is stored on a server; everything stays in your browser.
What's the difference between this calculator and the standalone tools (Buy vs Rent, Refinance, Fixed vs ARM, Tax Benefit, Investment, Move or Stay)? The main calculator is optimized for the home-purchase decision — should I buy this home, what will it really cost, and is this the right financial move? The standalone tools go deeper on specific questions: the Buy vs Rent Calculator has more scenario levers, the Investment Property Analyzer handles rental underwriting, and the Move or Stay Analyzer models four simultaneous paths for homeowners relocating. All tools are free and work independently.